Climate Change Chart of Muscat, Oman
Comprehensive Climate Change Chart of Muscat, Oman: Monthly Averages and Impact Trends
Exploring the climate change data in Muscat, Oman reveals intriguing insights into temperature, rainfall, and sunshine duration trends over the years.
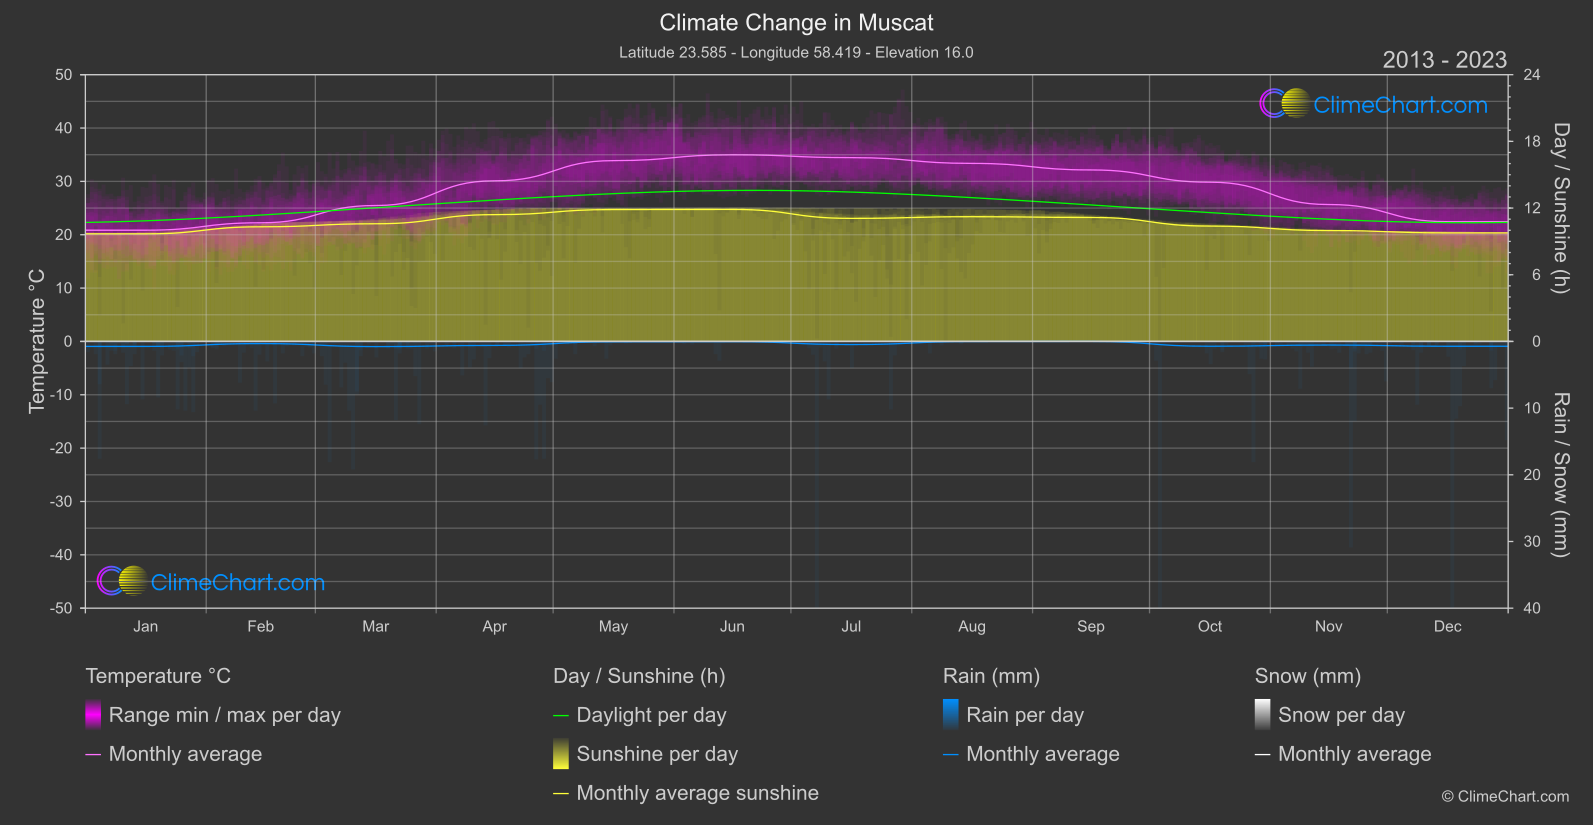
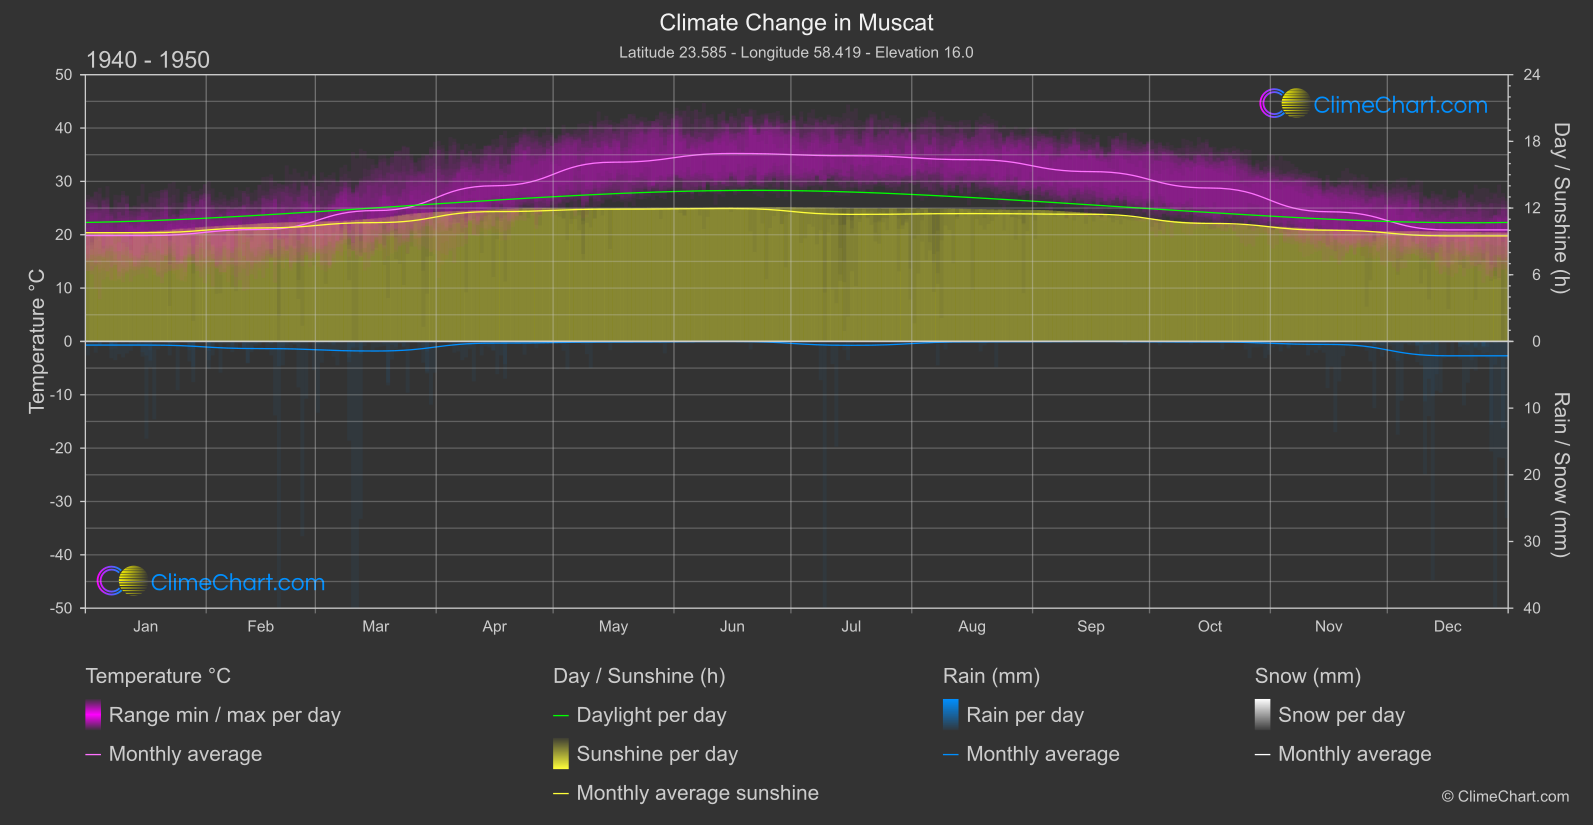
Muscat, the capital city of Oman, experiences a significant rise in temperature from January to August, with the greatest change occurring in December. Rainfall data indicates a decrease in precipitation from February to September, while sunshine duration sees a decline from July to October, with notable fluctuations in April and December.
Climate Change Data Overview for Muscat, Oman
Explore the comprehensive climate change data for Muscat, Oman. This detailed table provides valuable insights into temperature variations, precipitation levels, and seasonal changes influenced by climate change, helping you understand the unique weather patterns of this region.
Temperature °C
| Month | ⌀ 1940 - 1950 | ⌀ 2013 - 2023 | +/- |
|---|---|---|---|
| Jan | 19.85 | 20.85 | 1.00 |
| Feb | 20.99 | 22.24 | 1.25 |
| Mar | 24.53 | 25.48 | 0.95 |
| Apr | 29.18 | 30.10 | 0.92 |
| May | 33.60 | 33.89 | 0.29 |
| Jun | 35.23 | 34.99 | -0.24 |
| Jul | 34.80 | 34.45 | -0.35 |
| Aug | 34.07 | 33.37 | -0.69 |
| Sep | 31.83 | 32.14 | 0.31 |
| Oct | 28.76 | 29.85 | 1.09 |
| Nov | 24.31 | 25.66 | 1.36 |
| Dec | 20.91 | 22.45 | 1.54 |
| ⌀ Month | 28.17 | 28.79 | 0.62 |
Sunshine (h)
| Month | ⌀ 1940 - 1950 | ⌀ 2013 - 2023 | +/- |
|---|---|---|---|
| Jan | 9.79 | 9.68 | -0.11 |
| Feb | 10.21 | 10.31 | 0.10 |
| Mar | 10.69 | 10.59 | -0.11 |
| Apr | 11.68 | 11.41 | -0.28 |
| May | 11.90 | 11.87 | -0.04 |
| Jun | 11.96 | 11.88 | -0.08 |
| Jul | 11.43 | 11.07 | -0.36 |
| Aug | 11.50 | 11.22 | -0.28 |
| Sep | 11.44 | 11.15 | -0.28 |
| Oct | 10.62 | 10.38 | -0.24 |
| Nov | 10.01 | 9.98 | -0.03 |
| Dec | 9.50 | 9.77 | 0.27 |
| ⌀ Month | 10.89 | 10.78 | -0.12 |
Rain (mm)
| Month | ⌀ 1940 - 1950 | ⌀ 2013 - 2023 | +/- |
|---|---|---|---|
| Jan | 0.27 | 0.37 | 0.10 |
| Feb | 0.54 | 0.16 | -0.38 |
| Mar | 0.72 | 0.39 | -0.33 |
| Apr | 0.13 | 0.30 | 0.17 |
| May | 0.05 | 0.03 | -0.02 |
| Jun | 0.00 | 0.02 | 0.01 |
| Jul | 0.29 | 0.23 | -0.06 |
| Aug | 0.03 | 0.01 | -0.02 |
| Sep | 0.00 | 0.00 | -0.00 |
| Oct | 0.04 | 0.36 | 0.32 |
| Nov | 0.22 | 0.27 | 0.05 |
| Dec | 1.08 | 0.36 | -0.71 |
| ⌀ Month | 0.28 | 0.21 | -0.07 |
Snow (mm)
| Month | ⌀ 1940 - 1950 | ⌀ 2013 - 2023 | +/- |
|---|---|---|---|
| Jan | 0.00 | 0.00 | 0.00 |
| Feb | 0.00 | 0.00 | 0.00 |
| Mar | 0.00 | 0.00 | 0.00 |
| Apr | 0.00 | 0.00 | 0.00 |
| May | 0.00 | 0.00 | 0.00 |
| Jun | 0.00 | 0.00 | 0.00 |
| Jul | 0.00 | 0.00 | 0.00 |
| Aug | 0.00 | 0.00 | 0.00 |
| Sep | 0.00 | 0.00 | 0.00 |
| Oct | 0.00 | 0.00 | 0.00 |
| Nov | 0.00 | 0.00 | 0.00 |
| Dec | 0.00 | 0.00 | 0.00 |
| ⌀ Month | 0.00 | 0.00 | 0.00 |