Climate Change Chart of Mugla, Türkiye
Comprehensive Climate Change Chart of Mugla, Türkiye: Monthly Averages and Impact Trends
Explore the changing climate in Mugla, Turkey with data insights on temperature, rainfall, snowfall, and sunshine duration. Discover how climate patterns have evolved over time.
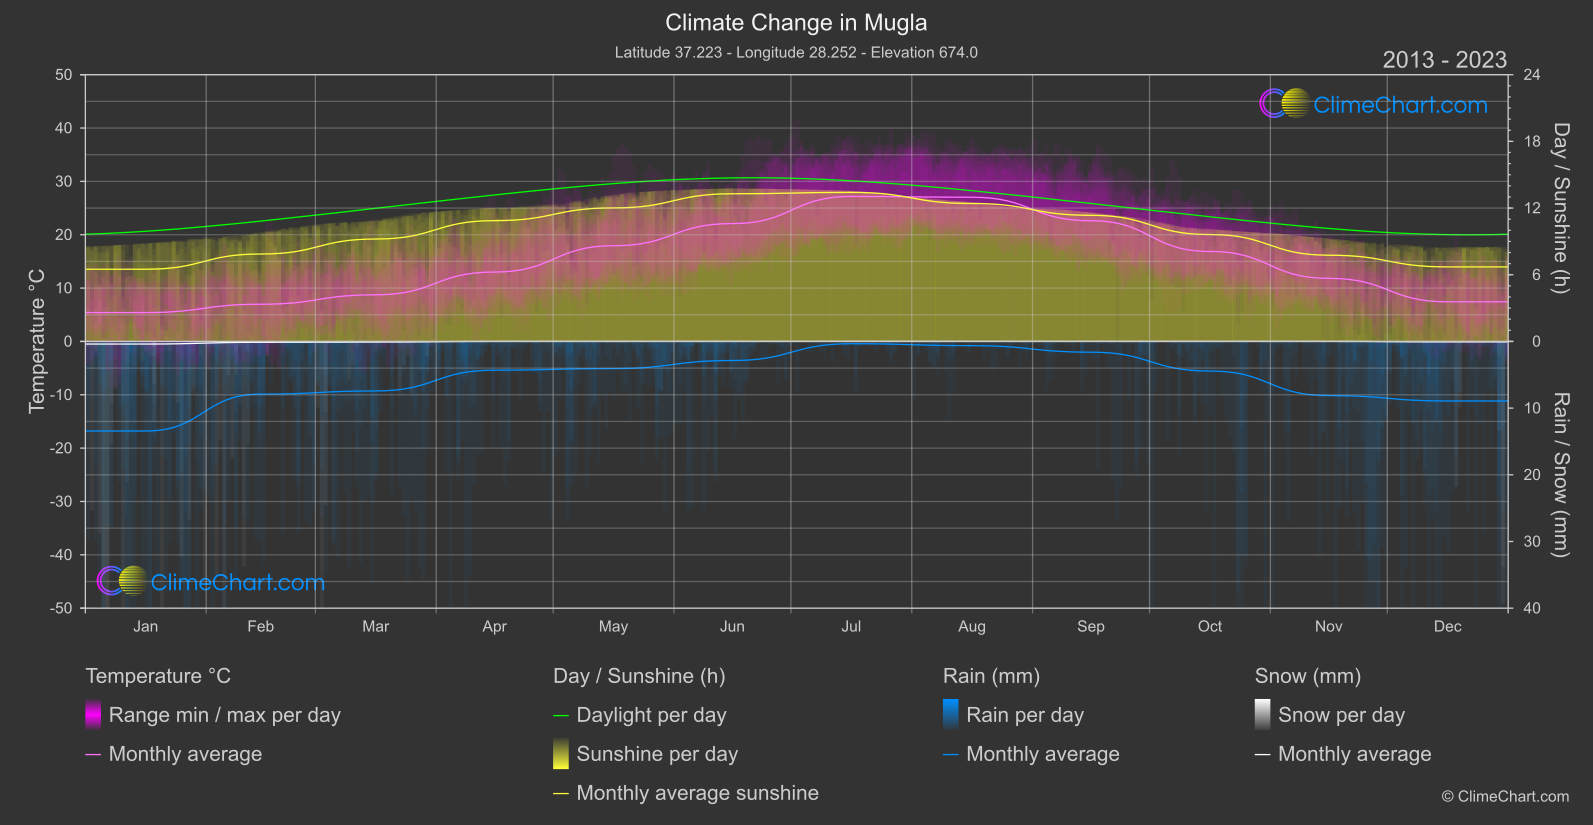
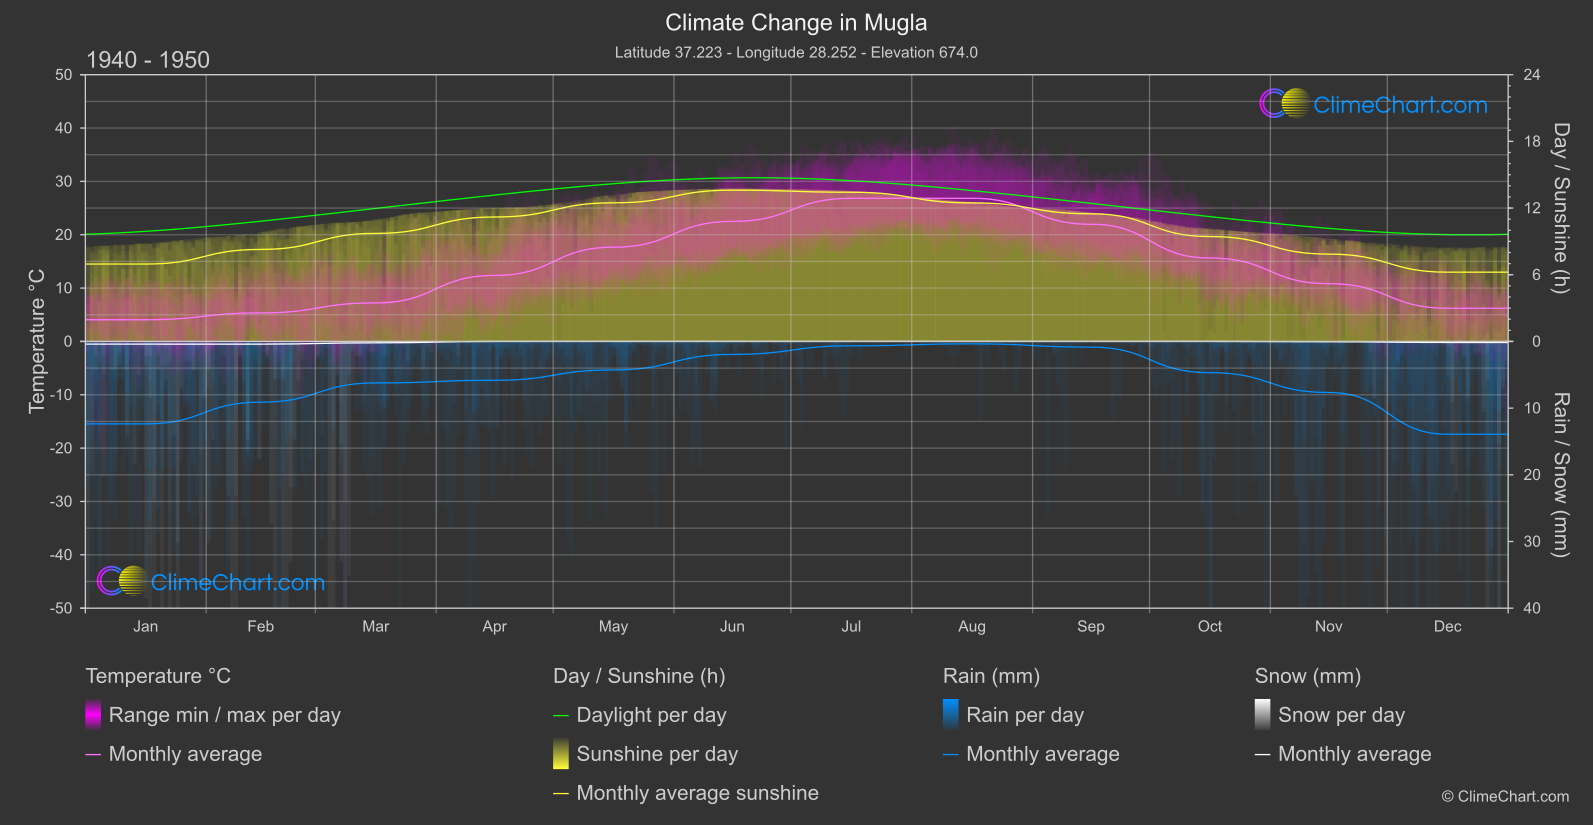
Mugla, Turkey experiences varying climate changes as reflected in the temperature, rainfall, snowfall, and sunshine duration data. From analyzing the temperature changes by month, it is evident that October has shown the highest increase in temperature over the years. In terms of rainfall, the most significant change was observed in December, with a notable decrease. Snowfall has generally decreased or remained minimal throughout the months. Additionally, the sunshine duration has seen fluctuations, with a notable decrease in August. These insights provide a comprehensive view of the evolving climate patterns in Mugla, Turkey.
Climate Change Data Overview for Mugla, Türkiye
Explore the comprehensive climate change data for Mugla, Türkiye. This detailed table provides valuable insights into temperature variations, precipitation levels, and seasonal changes influenced by climate change, helping you understand the unique weather patterns of this region.
Temperature °C
| Month | ⌀ 1940 - 1950 | ⌀ 2013 - 2023 | +/- |
|---|---|---|---|
| Jan | 4.07 | 5.41 | 1.35 |
| Feb | 5.35 | 6.97 | 1.63 |
| Mar | 7.22 | 8.74 | 1.52 |
| Apr | 12.37 | 13.01 | 0.65 |
| May | 17.66 | 17.94 | 0.27 |
| Jun | 22.50 | 22.10 | -0.40 |
| Jul | 26.83 | 27.18 | 0.35 |
| Aug | 26.83 | 27.03 | 0.20 |
| Sep | 21.96 | 22.61 | 0.65 |
| Oct | 15.64 | 16.86 | 1.22 |
| Nov | 10.83 | 11.83 | 1.00 |
| Dec | 6.22 | 7.42 | 1.20 |
| ⌀ Month | 14.79 | 15.59 | 0.80 |
Sunshine (h)
| Month | ⌀ 1940 - 1950 | ⌀ 2013 - 2023 | +/- |
|---|---|---|---|
| Jan | 6.96 | 6.50 | -0.47 |
| Feb | 8.28 | 7.86 | -0.41 |
| Mar | 9.72 | 9.21 | -0.51 |
| Apr | 11.20 | 10.87 | -0.33 |
| May | 12.47 | 12.01 | -0.46 |
| Jun | 13.61 | 13.29 | -0.32 |
| Jul | 13.42 | 13.41 | -0.01 |
| Aug | 12.46 | 12.41 | -0.05 |
| Sep | 11.48 | 11.35 | -0.14 |
| Oct | 9.44 | 9.62 | 0.18 |
| Nov | 7.86 | 7.76 | -0.10 |
| Dec | 6.23 | 6.70 | 0.47 |
| ⌀ Month | 10.26 | 10.08 | -0.18 |
Rain (mm)
| Month | ⌀ 1940 - 1950 | ⌀ 2013 - 2023 | +/- |
|---|---|---|---|
| Jan | 6.18 | 6.72 | 0.53 |
| Feb | 4.55 | 3.95 | -0.60 |
| Mar | 3.11 | 3.71 | 0.60 |
| Apr | 2.91 | 2.15 | -0.76 |
| May | 2.14 | 2.03 | -0.10 |
| Jun | 0.97 | 1.43 | 0.46 |
| Jul | 0.33 | 0.17 | -0.16 |
| Aug | 0.18 | 0.32 | 0.14 |
| Sep | 0.43 | 0.81 | 0.38 |
| Oct | 2.34 | 2.22 | -0.12 |
| Nov | 3.83 | 4.06 | 0.23 |
| Dec | 6.96 | 4.47 | -2.49 |
| ⌀ Month | 2.83 | 2.67 | -0.16 |
Snow (mm)
| Month | ⌀ 1940 - 1950 | ⌀ 2013 - 2023 | +/- |
|---|---|---|---|
| Jan | 0.20 | 0.20 | -0.01 |
| Feb | 0.20 | 0.06 | -0.14 |
| Mar | 0.10 | 0.05 | -0.06 |
| Apr | 0.00 | 0.00 | -0.00 |
| May | 0.00 | 0.00 | 0.00 |
| Jun | 0.00 | 0.00 | 0.00 |
| Jul | 0.00 | 0.00 | 0.00 |
| Aug | 0.00 | 0.00 | 0.00 |
| Sep | 0.00 | 0.00 | 0.00 |
| Oct | 0.00 | 0.00 | 0.00 |
| Nov | 0.02 | 0.00 | -0.02 |
| Dec | 0.08 | 0.04 | -0.04 |
| ⌀ Month | 0.05 | 0.03 | -0.02 |