Climate Change Chart of Moscow, Russian Federation
Comprehensive Climate Change Chart of Moscow, Russian Federation: Monthly Averages and Impact Trends
Exploring the changing climate patterns in Moscow, Russian Federation reveals intriguing insights into temperature, rainfall, snowfall, and sunshine duration.
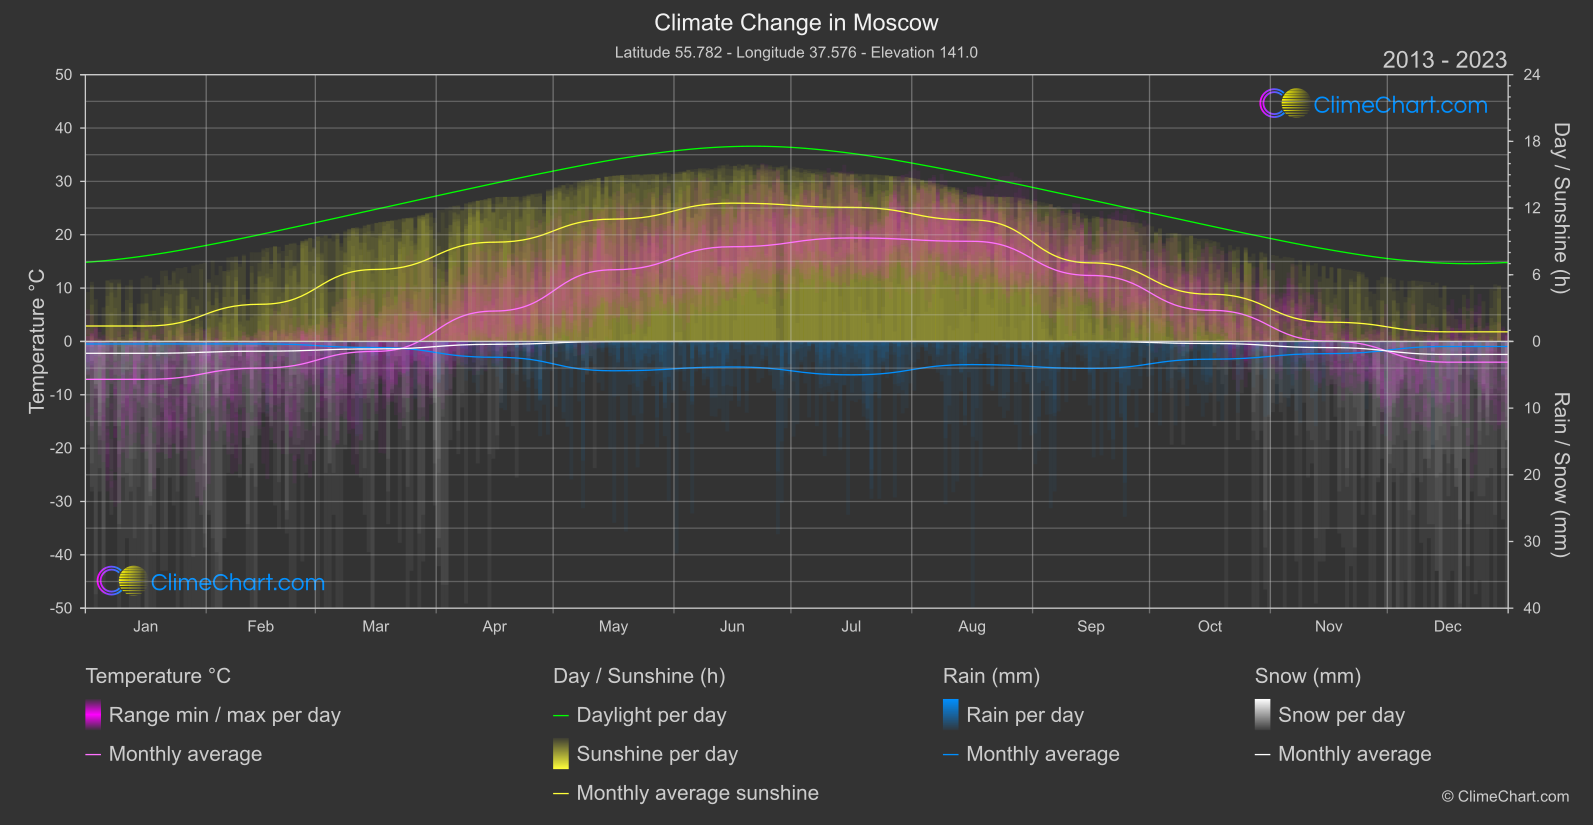
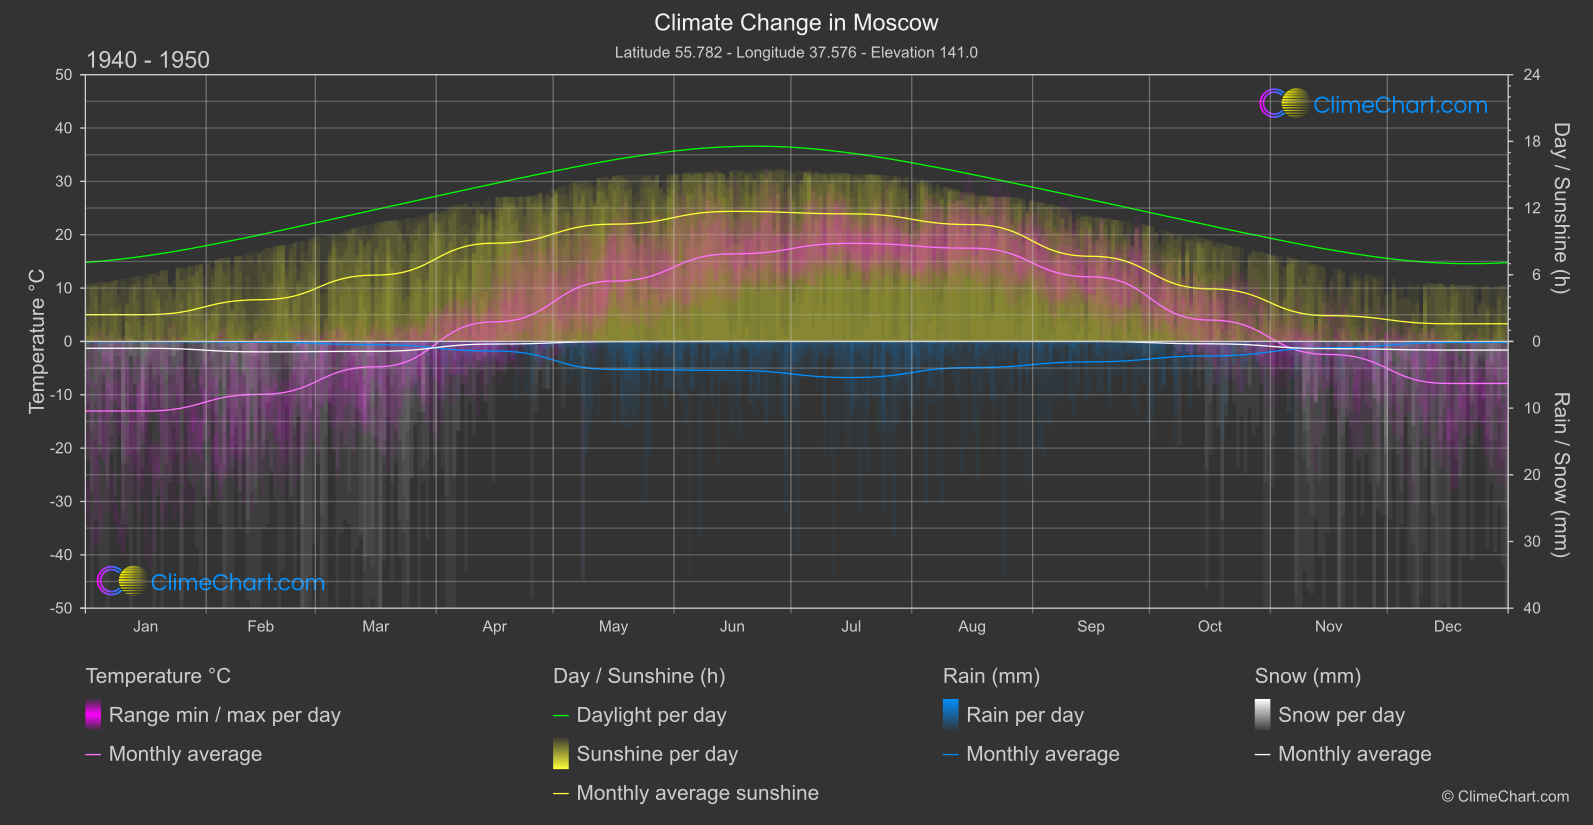
Moscow, the capital city of Russia, experiences notable changes in climate parameters. The data from 1940-1950 compared to 2013-2024 indicates a significant increase in temperatures, particularly during the months of May and June. Additionally, the rainfall patterns show varying trends, with September witnessing a substantial increase in precipitation levels. Snowfall has seen fluctuations, with some months showing a decrease. Sunshine duration also displays changing patterns, with a general decrease in hours of sunlight during the colder months.
Climate Change Data Overview for Moscow, Russian Federation
Explore the comprehensive climate change data for Moscow, Russian Federation. This detailed table provides valuable insights into temperature variations, precipitation levels, and seasonal changes influenced by climate change, helping you understand the unique weather patterns of this region.
Temperature °C
| Month | ⌀ 1940 - 1950 | ⌀ 2013 - 2023 | +/- |
|---|---|---|---|
| Jan | -13.05 | -7.10 | 5.95 |
| Feb | -9.91 | -4.99 | 4.92 |
| Mar | -4.76 | -1.86 | 2.90 |
| Apr | 3.67 | 5.70 | 2.02 |
| May | 11.32 | 13.44 | 2.12 |
| Jun | 16.41 | 17.75 | 1.34 |
| Jul | 18.39 | 19.40 | 1.00 |
| Aug | 17.48 | 18.77 | 1.29 |
| Sep | 12.11 | 12.36 | 0.26 |
| Oct | 4.00 | 5.84 | 1.84 |
| Nov | -2.45 | 0.06 | 2.51 |
| Dec | -7.88 | -3.89 | 3.99 |
| ⌀ Month | 3.78 | 6.29 | 2.51 |
Sunshine (h)
| Month | ⌀ 1940 - 1950 | ⌀ 2013 - 2023 | +/- |
|---|---|---|---|
| Jan | 2.41 | 1.39 | -1.02 |
| Feb | 3.75 | 3.34 | -0.41 |
| Mar | 5.97 | 6.47 | 0.50 |
| Apr | 8.84 | 8.93 | 0.09 |
| May | 10.55 | 11.00 | 0.45 |
| Jun | 11.70 | 12.44 | 0.74 |
| Jul | 11.48 | 12.06 | 0.58 |
| Aug | 10.51 | 10.93 | 0.42 |
| Sep | 7.66 | 7.07 | -0.59 |
| Oct | 4.74 | 4.25 | -0.49 |
| Nov | 2.32 | 1.73 | -0.59 |
| Dec | 1.59 | 0.86 | -0.73 |
| ⌀ Month | 6.79 | 6.71 | -0.09 |
Rain (mm)
| Month | ⌀ 1940 - 1950 | ⌀ 2013 - 2023 | +/- |
|---|---|---|---|
| Jan | 0.03 | 0.19 | 0.16 |
| Feb | 0.05 | 0.19 | 0.13 |
| Mar | 0.24 | 0.46 | 0.21 |
| Apr | 0.72 | 1.19 | 0.47 |
| May | 2.10 | 2.20 | 0.10 |
| Jun | 2.17 | 1.91 | -0.26 |
| Jul | 2.71 | 2.50 | -0.20 |
| Aug | 1.96 | 1.74 | -0.22 |
| Sep | 1.53 | 2.02 | 0.49 |
| Oct | 1.09 | 1.33 | 0.25 |
| Nov | 0.48 | 0.91 | 0.43 |
| Dec | 0.09 | 0.38 | 0.29 |
| ⌀ Month | 1.10 | 1.25 | 0.15 |
Snow (mm)
| Month | ⌀ 1940 - 1950 | ⌀ 2013 - 2023 | +/- |
|---|---|---|---|
| Jan | 0.51 | 0.89 | 0.38 |
| Feb | 0.78 | 0.73 | -0.05 |
| Mar | 0.74 | 0.56 | -0.18 |
| Apr | 0.19 | 0.21 | 0.02 |
| May | 0.01 | 0.01 | -0.00 |
| Jun | 0.00 | 0.00 | 0.00 |
| Jul | 0.00 | 0.00 | 0.00 |
| Aug | 0.00 | 0.00 | 0.00 |
| Sep | 0.00 | 0.00 | -0.00 |
| Oct | 0.18 | 0.15 | -0.02 |
| Nov | 0.54 | 0.46 | -0.07 |
| Dec | 0.65 | 0.97 | 0.33 |
| ⌀ Month | 0.30 | 0.33 | 0.03 |