Climate Change Chart of Montpelier, USA
Comprehensive Climate Change Chart of Montpelier, USA: Monthly Averages and Impact Trends
Explore the changing climate in Montpelier, USA, through insightful data analysis. Discover how temperature, rainfall, snowfall, and sunshine duration have evolved from 1940 to 1950 compared to 2013 to 2024.
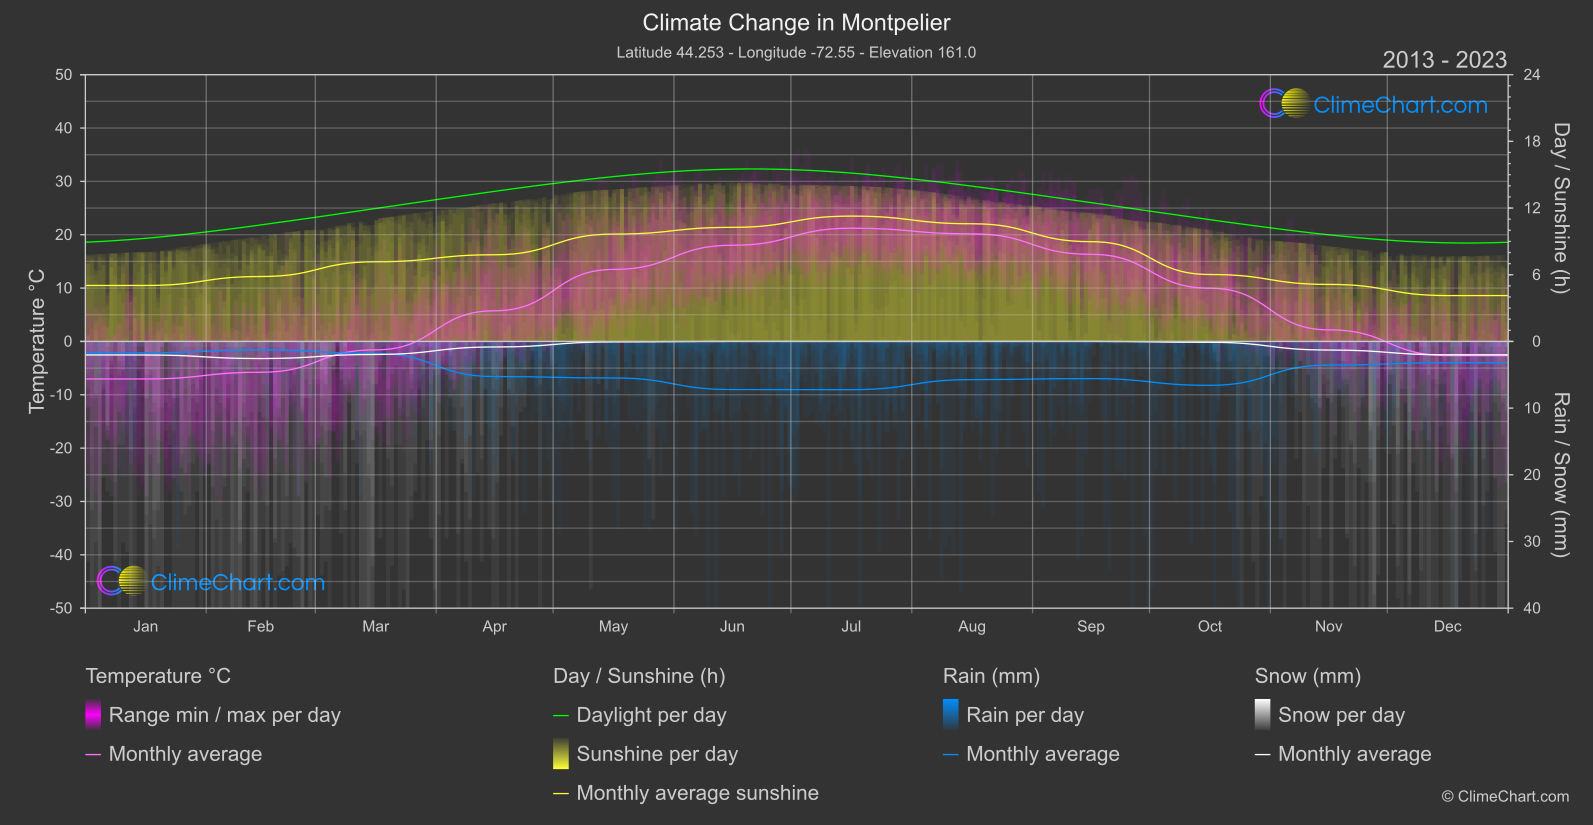
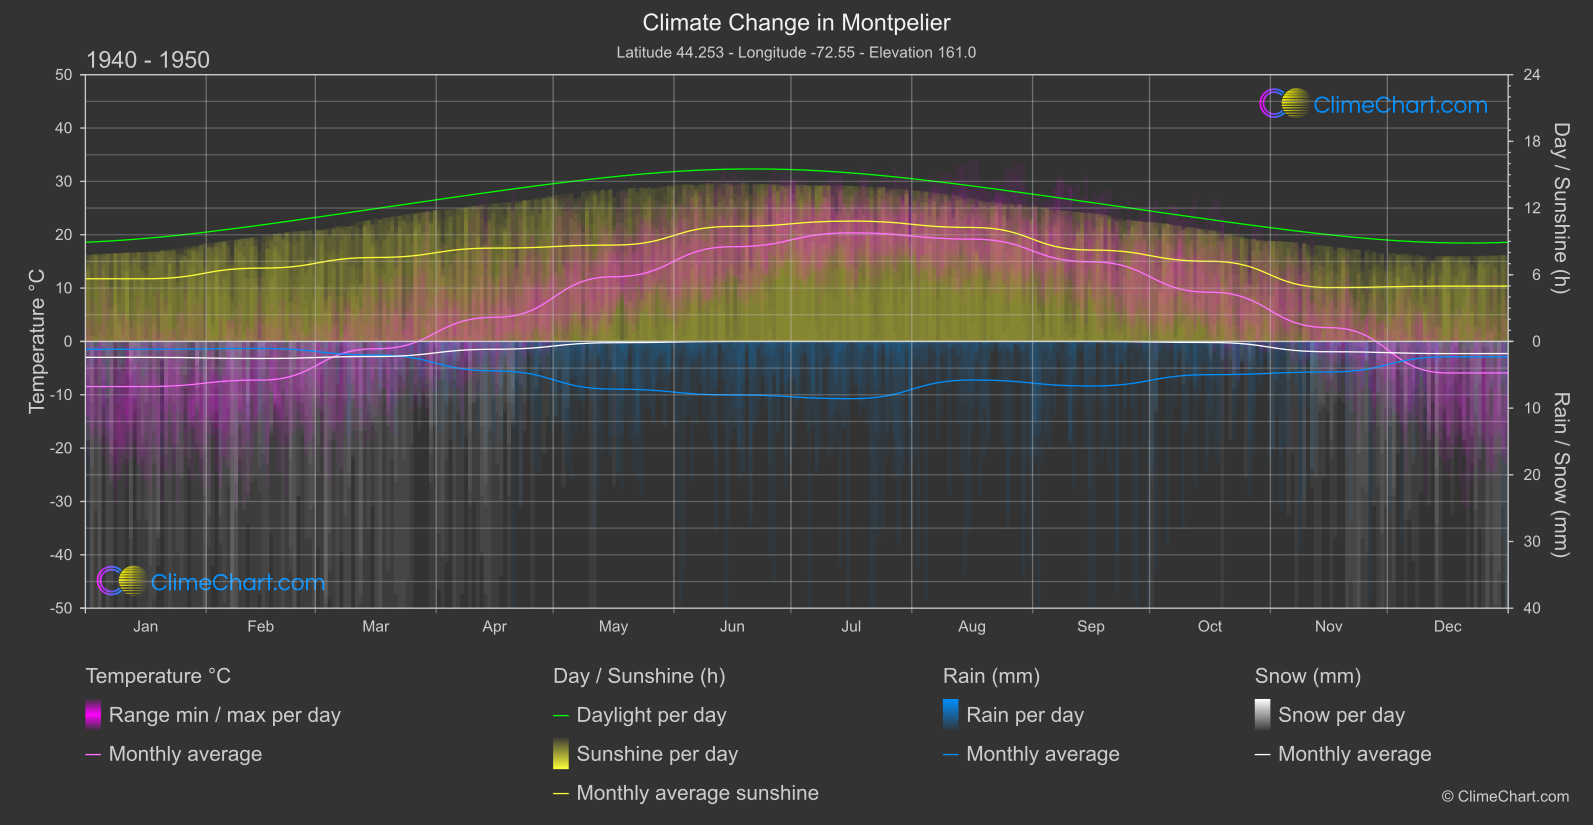
Delve deeper into the climate and weather patterns of Montpelier, USA, with a focus on temperature, rainfall, snowfall, and sunshine duration. The data from 1940 to 1950 compared to 2013 to 2024 reveals interesting insights, such as the changing trends across different months. For example, the month with the highest temperature change or rainfall variation can provide valuable information about the evolving climate dynamics in Montpelier.
Climate Change Data Overview for Montpelier, USA
Explore the comprehensive climate change data for Montpelier, USA. This detailed table provides valuable insights into temperature variations, precipitation levels, and seasonal changes influenced by climate change, helping you understand the unique weather patterns of this region.
Temperature °C
| Month | ⌀ 1940 - 1950 | ⌀ 2013 - 2023 | +/- |
|---|---|---|---|
| Jan | -8.46 | -7.04 | 1.42 |
| Feb | -7.24 | -5.78 | 1.46 |
| Mar | -1.38 | -1.58 | -0.20 |
| Apr | 4.52 | 5.75 | 1.23 |
| May | 12.12 | 13.50 | 1.37 |
| Jun | 17.75 | 18.03 | 0.28 |
| Jul | 20.35 | 21.22 | 0.86 |
| Aug | 19.18 | 20.17 | 0.99 |
| Sep | 14.92 | 16.33 | 1.41 |
| Oct | 9.22 | 9.98 | 0.75 |
| Nov | 2.59 | 2.17 | -0.41 |
| Dec | -5.91 | -2.65 | 3.26 |
| ⌀ Month | 6.47 | 7.51 | 1.04 |
Sunshine (h)
| Month | ⌀ 1940 - 1950 | ⌀ 2013 - 2023 | +/- |
|---|---|---|---|
| Jan | 5.64 | 5.04 | -0.60 |
| Feb | 6.60 | 5.84 | -0.76 |
| Mar | 7.55 | 7.17 | -0.38 |
| Apr | 8.40 | 7.80 | -0.60 |
| May | 8.67 | 9.66 | 0.99 |
| Jun | 10.35 | 10.27 | -0.08 |
| Jul | 10.83 | 11.28 | 0.45 |
| Aug | 10.25 | 10.59 | 0.33 |
| Sep | 8.22 | 8.98 | 0.75 |
| Oct | 7.21 | 6.02 | -1.19 |
| Nov | 4.85 | 5.13 | 0.28 |
| Dec | 4.98 | 4.13 | -0.85 |
| ⌀ Month | 7.80 | 7.66 | -0.14 |
Rain (mm)
| Month | ⌀ 1940 - 1950 | ⌀ 2013 - 2023 | +/- |
|---|---|---|---|
| Jan | 0.59 | 0.86 | 0.27 |
| Feb | 0.53 | 0.63 | 0.11 |
| Mar | 1.02 | 0.91 | -0.11 |
| Apr | 2.21 | 2.63 | 0.43 |
| May | 3.57 | 2.74 | -0.83 |
| Jun | 4.01 | 3.61 | -0.40 |
| Jul | 4.29 | 3.62 | -0.68 |
| Aug | 2.89 | 2.86 | -0.03 |
| Sep | 3.34 | 2.79 | -0.55 |
| Oct | 2.49 | 3.29 | 0.80 |
| Nov | 2.29 | 1.77 | -0.52 |
| Dec | 1.15 | 1.59 | 0.44 |
| ⌀ Month | 2.37 | 2.28 | -0.09 |
Snow (mm)
| Month | ⌀ 1940 - 1950 | ⌀ 2013 - 2023 | +/- |
|---|---|---|---|
| Jan | 1.20 | 1.02 | -0.18 |
| Feb | 1.28 | 1.28 | 0.00 |
| Mar | 1.13 | 0.98 | -0.15 |
| Apr | 0.59 | 0.42 | -0.17 |
| May | 0.09 | 0.04 | -0.06 |
| Jun | 0.00 | 0.00 | 0.00 |
| Jul | 0.00 | 0.00 | 0.00 |
| Aug | 0.00 | 0.00 | 0.00 |
| Sep | 0.00 | 0.00 | 0.00 |
| Oct | 0.08 | 0.07 | -0.01 |
| Nov | 0.77 | 0.64 | -0.13 |
| Dec | 0.91 | 1.00 | 0.09 |
| ⌀ Month | 0.50 | 0.45 | -0.05 |