Climate Change Chart of Monterrey, Mexico
Comprehensive Climate Change Chart of Monterrey, Mexico: Monthly Averages and Impact Trends
Explore the changing climate in Monterrey, Mexico with detailed insights and data analysis.
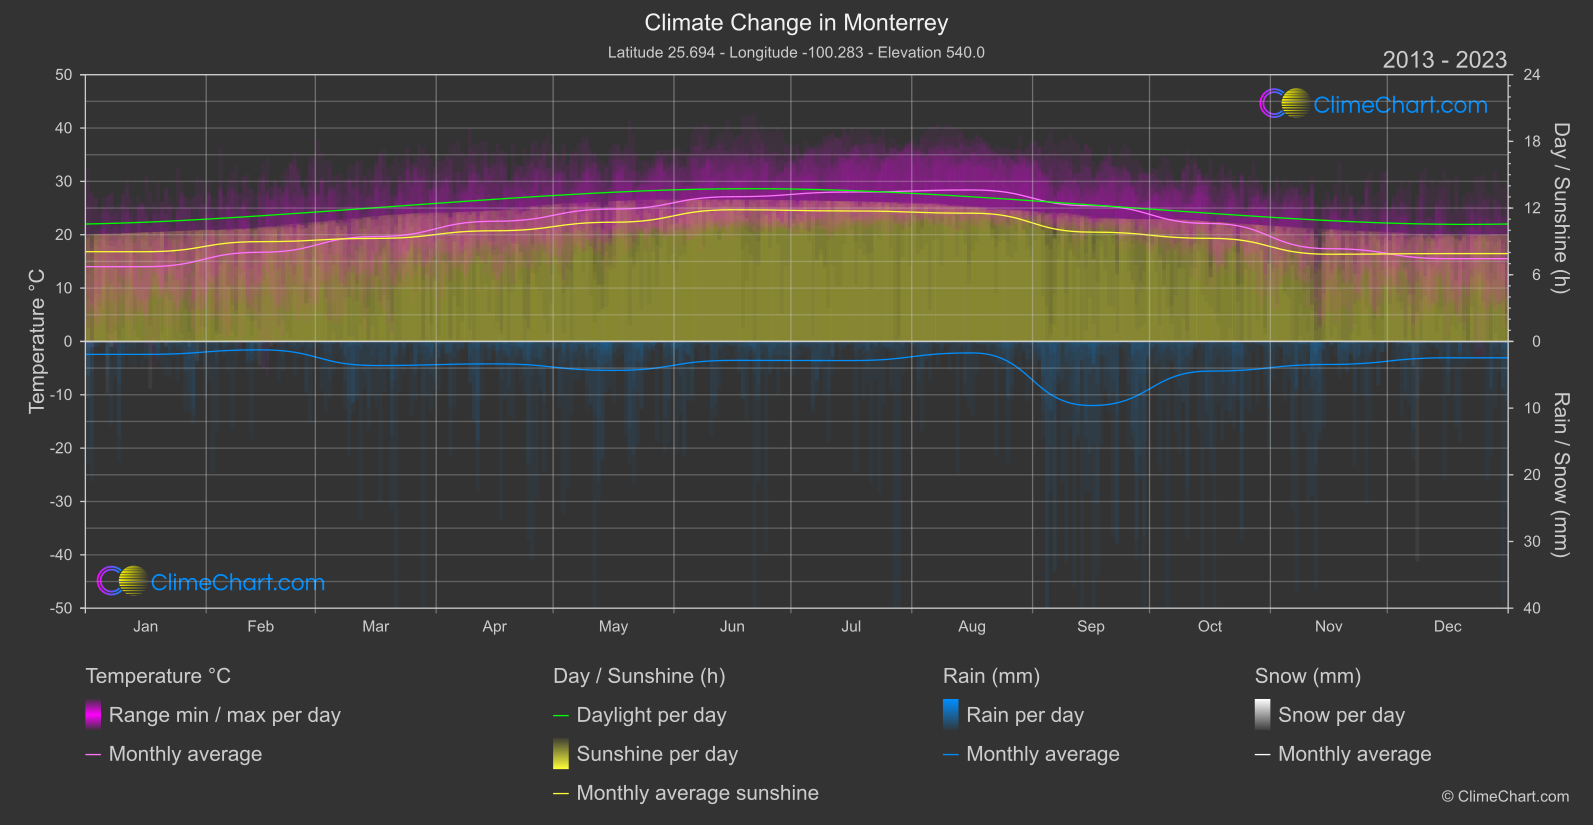
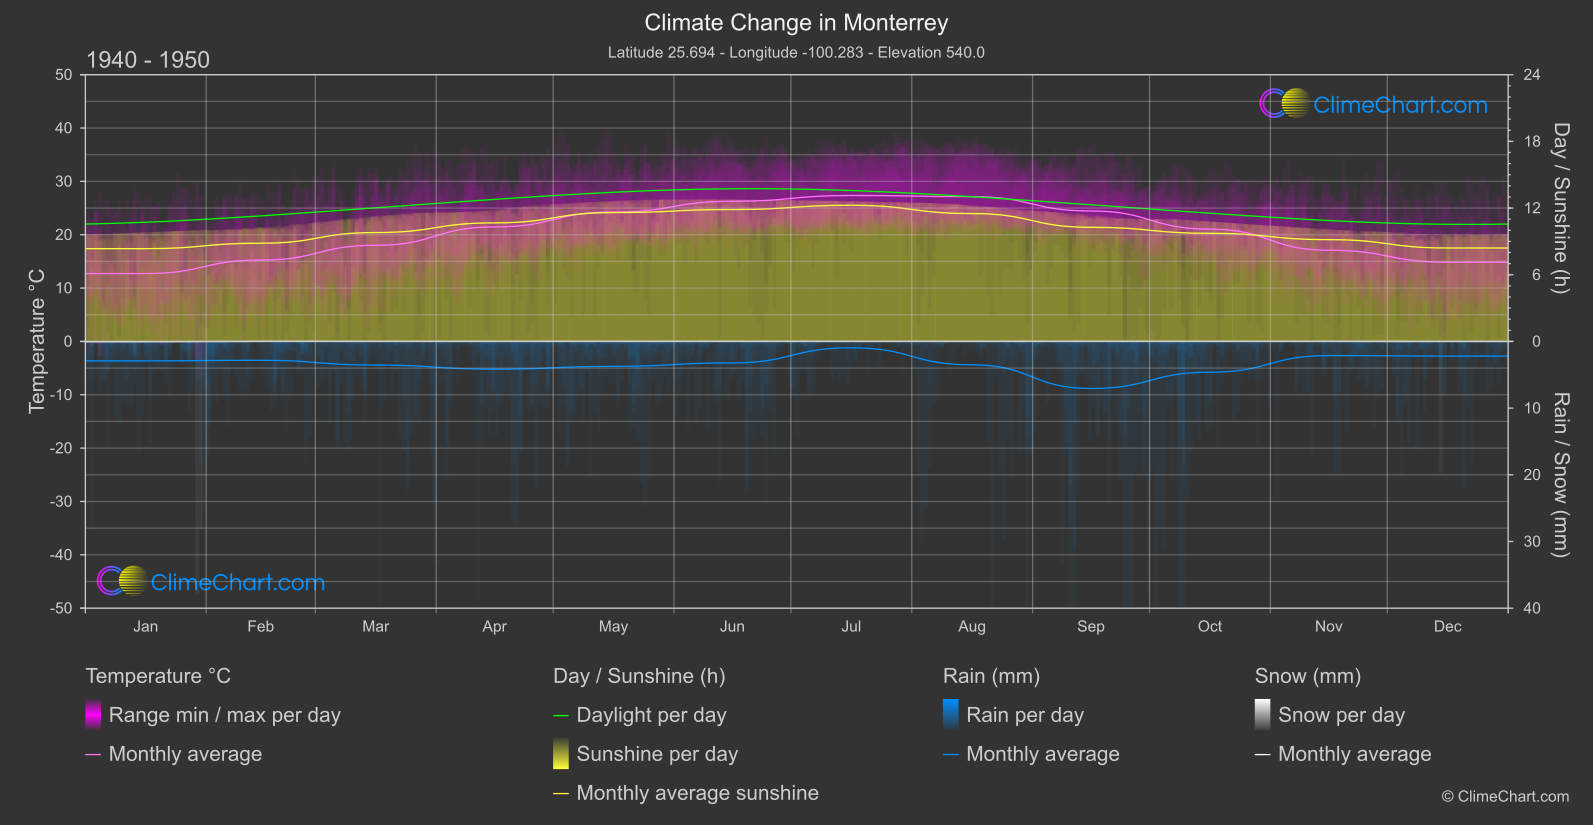
Monterrey, Mexico experiences varying climate changes over the years. From temperature fluctuations to rainfall patterns, the data provides valuable insights. The month with the highest temperature change is August, with a difference of 1.25°C between the years 1940-1950 and 2013-2024. In terms of rainfall, September shows the most significant increase of 1.28 mm compared to the same periods. Explore the data further to understand the evolving climate in Monterrey.
Climate Change Data Overview for Monterrey, Mexico
Explore the comprehensive climate change data for Monterrey, Mexico. This detailed table provides valuable insights into temperature variations, precipitation levels, and seasonal changes influenced by climate change, helping you understand the unique weather patterns of this region.
Temperature °C
| Month | ⌀ 1940 - 1950 | ⌀ 2013 - 2023 | +/- |
|---|---|---|---|
| Jan | 12.72 | 14.01 | 1.30 |
| Feb | 15.26 | 16.72 | 1.46 |
| Mar | 18.02 | 19.66 | 1.64 |
| Apr | 21.47 | 22.53 | 1.06 |
| May | 24.26 | 24.82 | 0.55 |
| Jun | 26.27 | 27.12 | 0.85 |
| Jul | 27.36 | 28.01 | 0.65 |
| Aug | 27.14 | 28.39 | 1.25 |
| Sep | 24.45 | 25.43 | 0.98 |
| Oct | 21.05 | 22.11 | 1.06 |
| Nov | 17.09 | 17.39 | 0.29 |
| Dec | 14.84 | 15.51 | 0.67 |
| ⌀ Month | 20.83 | 21.81 | 0.98 |
Sunshine (h)
| Month | ⌀ 1940 - 1950 | ⌀ 2013 - 2023 | +/- |
|---|---|---|---|
| Jan | 8.35 | 8.07 | -0.27 |
| Feb | 8.84 | 8.98 | 0.14 |
| Mar | 9.79 | 9.27 | -0.52 |
| Apr | 10.67 | 9.96 | -0.71 |
| May | 11.59 | 10.73 | -0.87 |
| Jun | 11.87 | 11.85 | -0.02 |
| Jul | 12.25 | 11.74 | -0.51 |
| Aug | 11.50 | 11.54 | 0.03 |
| Sep | 10.27 | 9.84 | -0.43 |
| Oct | 9.73 | 9.28 | -0.45 |
| Nov | 9.16 | 7.85 | -1.31 |
| Dec | 8.41 | 7.90 | -0.50 |
| ⌀ Month | 10.20 | 9.75 | -0.45 |
Rain (mm)
| Month | ⌀ 1940 - 1950 | ⌀ 2013 - 2023 | +/- |
|---|---|---|---|
| Jan | 1.46 | 0.97 | -0.49 |
| Feb | 1.41 | 0.63 | -0.78 |
| Mar | 1.77 | 1.81 | 0.03 |
| Apr | 2.08 | 1.68 | -0.40 |
| May | 1.87 | 2.17 | 0.30 |
| Jun | 1.61 | 1.42 | -0.19 |
| Jul | 0.48 | 1.44 | 0.96 |
| Aug | 1.75 | 0.86 | -0.89 |
| Sep | 3.53 | 4.81 | 1.28 |
| Oct | 2.31 | 2.22 | -0.08 |
| Nov | 1.06 | 1.73 | 0.67 |
| Dec | 1.10 | 1.23 | 0.13 |
| ⌀ Month | 1.70 | 1.75 | 0.05 |
Snow (mm)
| Month | ⌀ 1940 - 1950 | ⌀ 2013 - 2023 | +/- |
|---|---|---|---|
| Jan | 0.02 | 0.01 | -0.01 |
| Feb | 0.00 | 0.00 | 0.00 |
| Mar | 0.00 | 0.00 | 0.00 |
| Apr | 0.00 | 0.00 | 0.00 |
| May | 0.00 | 0.00 | 0.00 |
| Jun | 0.00 | 0.00 | 0.00 |
| Jul | 0.00 | 0.00 | 0.00 |
| Aug | 0.00 | 0.00 | 0.00 |
| Sep | 0.00 | 0.00 | 0.00 |
| Oct | 0.00 | 0.00 | 0.00 |
| Nov | 0.00 | 0.00 | 0.00 |
| Dec | 0.01 | 0.01 | 0.00 |
| ⌀ Month | 0.00 | 0.00 | -0.00 |