Climate Change Chart of Montego Bay, Jamaica
Comprehensive Climate Change Chart of Montego Bay, Jamaica: Monthly Averages and Impact Trends
Exploring the changing climate in Montego Bay, Jamaica reveals intriguing insights into temperature, rainfall, and sunshine duration trends over the years.
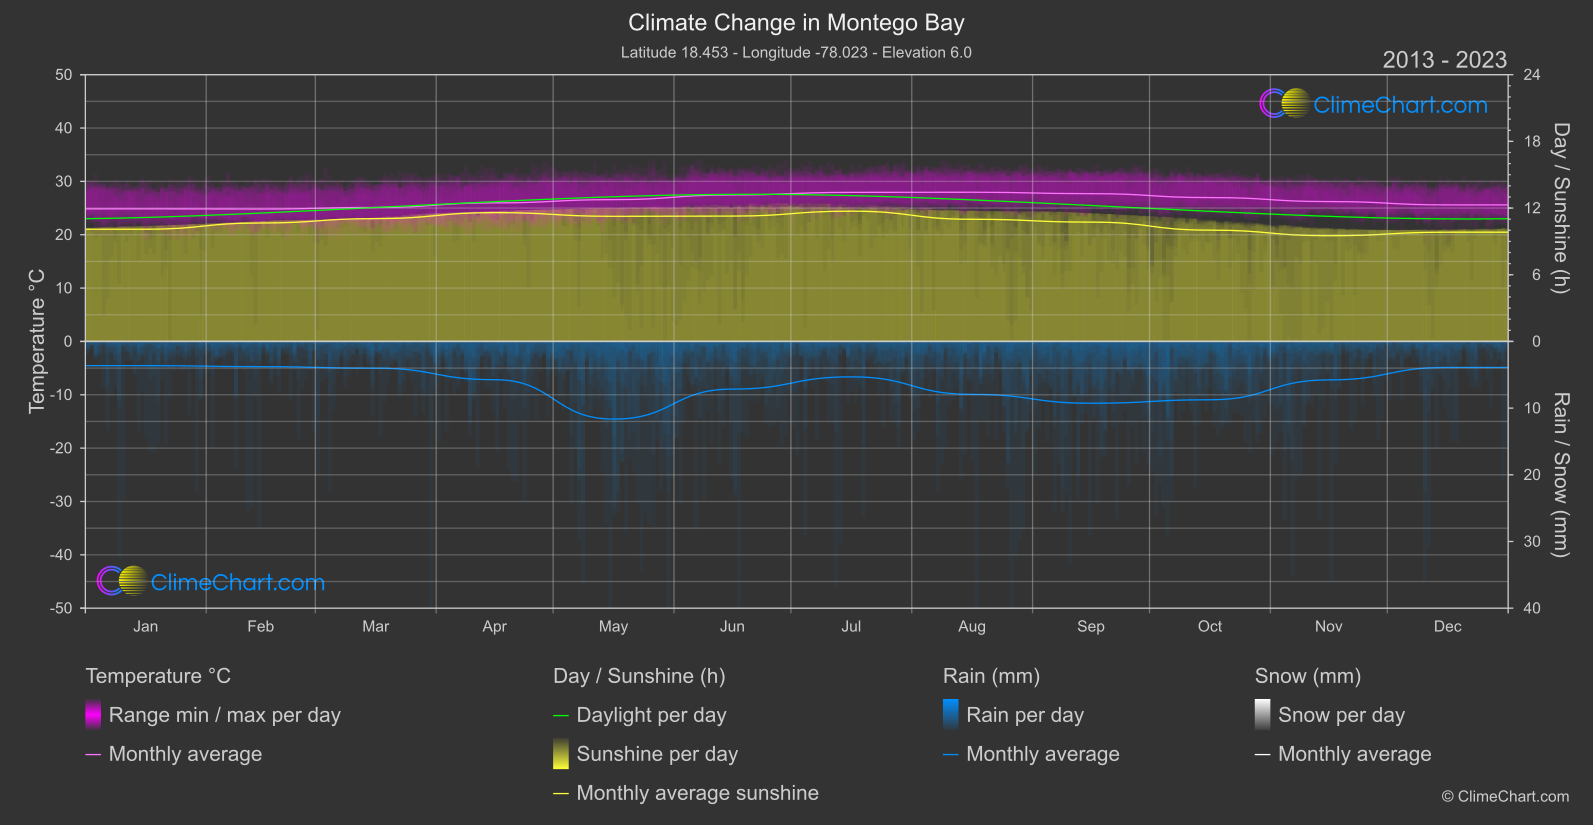
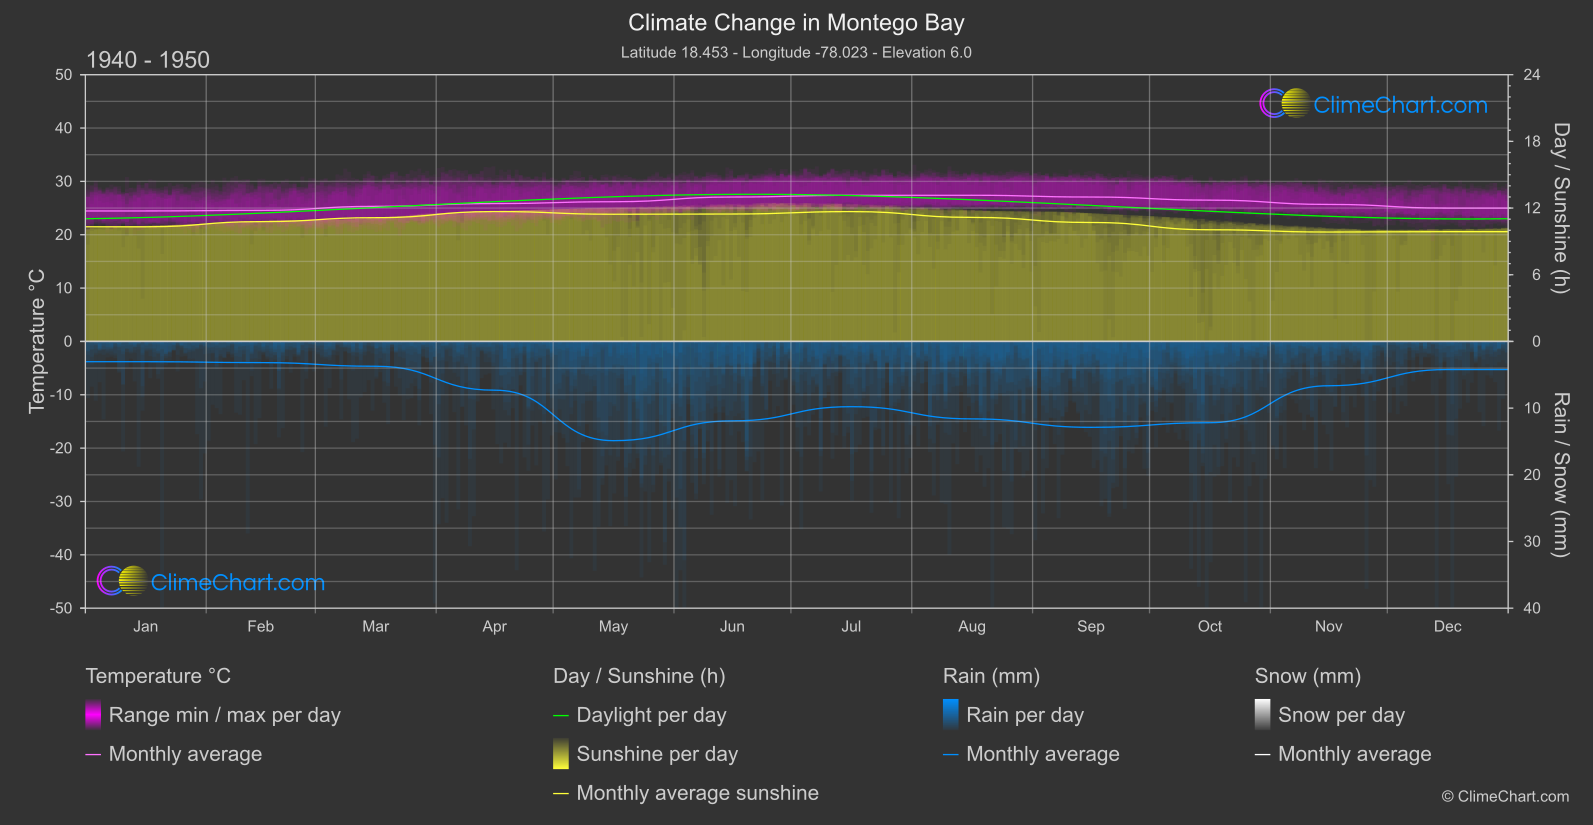
In Montego Bay, Jamaica, the data shows that the month of September experiences the highest change in temperature, with a significant increase of approximately 0.63°C from 1940-1950 to 2013-2024. Conversely, April has the highest change in rainfall, with a decrease of about 0.79 mm. When it comes to sunshine duration, July stands out with an increase of 0.56 hours. These fluctuations reflect the impact of climate change on Montego Bay's weather patterns, highlighting the need for sustainable environmental practices.
Climate Change Data Overview for Montego Bay, Jamaica
Explore the comprehensive climate change data for Montego Bay, Jamaica. This detailed table provides valuable insights into temperature variations, precipitation levels, and seasonal changes influenced by climate change, helping you understand the unique weather patterns of this region.
Temperature °C
| Month | ⌀ 1940 - 1950 | ⌀ 2013 - 2023 | +/- |
|---|---|---|---|
| Jan | 24.46 | 24.85 | 0.39 |
| Feb | 24.56 | 24.81 | 0.25 |
| Mar | 25.32 | 25.11 | -0.21 |
| Apr | 25.84 | 25.97 | 0.13 |
| May | 26.19 | 26.58 | 0.39 |
| Jun | 27.07 | 27.46 | 0.39 |
| Jul | 27.39 | 27.94 | 0.55 |
| Aug | 27.40 | 27.96 | 0.57 |
| Sep | 27.07 | 27.70 | 0.63 |
| Oct | 26.49 | 26.97 | 0.48 |
| Nov | 25.68 | 26.22 | 0.54 |
| Dec | 24.99 | 25.59 | 0.60 |
| ⌀ Month | 26.04 | 26.43 | 0.39 |
Sunshine (h)
| Month | ⌀ 1940 - 1950 | ⌀ 2013 - 2023 | +/- |
|---|---|---|---|
| Jan | 10.32 | 10.10 | -0.22 |
| Feb | 10.78 | 10.66 | -0.12 |
| Mar | 11.13 | 11.05 | -0.08 |
| Apr | 11.69 | 11.59 | -0.10 |
| May | 11.44 | 11.26 | -0.19 |
| Jun | 11.46 | 11.28 | -0.19 |
| Jul | 11.68 | 11.72 | 0.04 |
| Aug | 11.16 | 10.99 | -0.17 |
| Sep | 10.70 | 10.74 | 0.03 |
| Oct | 10.05 | 10.01 | -0.04 |
| Nov | 9.84 | 9.51 | -0.33 |
| Dec | 9.88 | 9.83 | -0.05 |
| ⌀ Month | 10.84 | 10.73 | -0.12 |
Rain (mm)
| Month | ⌀ 1940 - 1950 | ⌀ 2013 - 2023 | +/- |
|---|---|---|---|
| Jan | 1.52 | 1.81 | 0.29 |
| Feb | 1.59 | 1.89 | 0.30 |
| Mar | 1.86 | 2.01 | 0.14 |
| Apr | 3.66 | 2.87 | -0.79 |
| May | 7.44 | 5.82 | -1.62 |
| Jun | 5.96 | 3.57 | -2.38 |
| Jul | 4.89 | 2.66 | -2.24 |
| Aug | 5.81 | 3.97 | -1.84 |
| Sep | 6.44 | 4.63 | -1.81 |
| Oct | 6.09 | 4.37 | -1.72 |
| Nov | 3.32 | 2.88 | -0.44 |
| Dec | 2.11 | 1.95 | -0.16 |
| ⌀ Month | 4.22 | 3.20 | -1.02 |
Snow (mm)
| Month | ⌀ 1940 - 1950 | ⌀ 2013 - 2023 | +/- |
|---|---|---|---|
| Jan | 0.00 | 0.00 | 0.00 |
| Feb | 0.00 | 0.00 | 0.00 |
| Mar | 0.00 | 0.00 | 0.00 |
| Apr | 0.00 | 0.00 | 0.00 |
| May | 0.00 | 0.00 | 0.00 |
| Jun | 0.00 | 0.00 | 0.00 |
| Jul | 0.00 | 0.00 | 0.00 |
| Aug | 0.00 | 0.00 | 0.00 |
| Sep | 0.00 | 0.00 | 0.00 |
| Oct | 0.00 | 0.00 | 0.00 |
| Nov | 0.00 | 0.00 | 0.00 |
| Dec | 0.00 | 0.00 | 0.00 |
| ⌀ Month | 0.00 | 0.00 | 0.00 |