Climate Change Chart of Monrovia, Liberia
Comprehensive Climate Change Chart of Monrovia, Liberia: Monthly Averages and Impact Trends
Exploring the climate data of Monrovia, Liberia reveals significant changes in temperature, rainfall, and sunshine duration over the years.
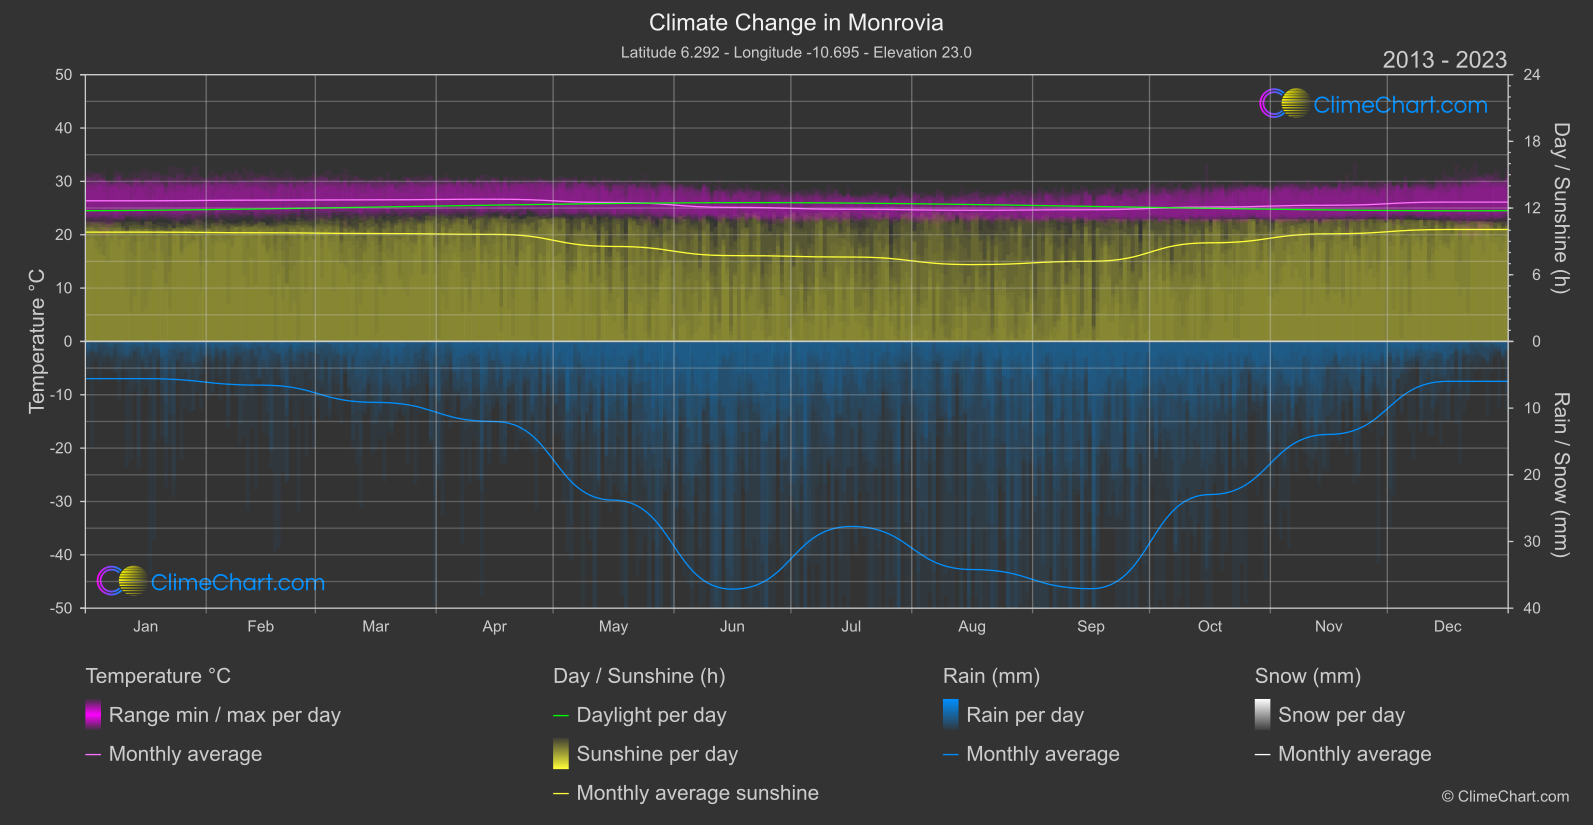
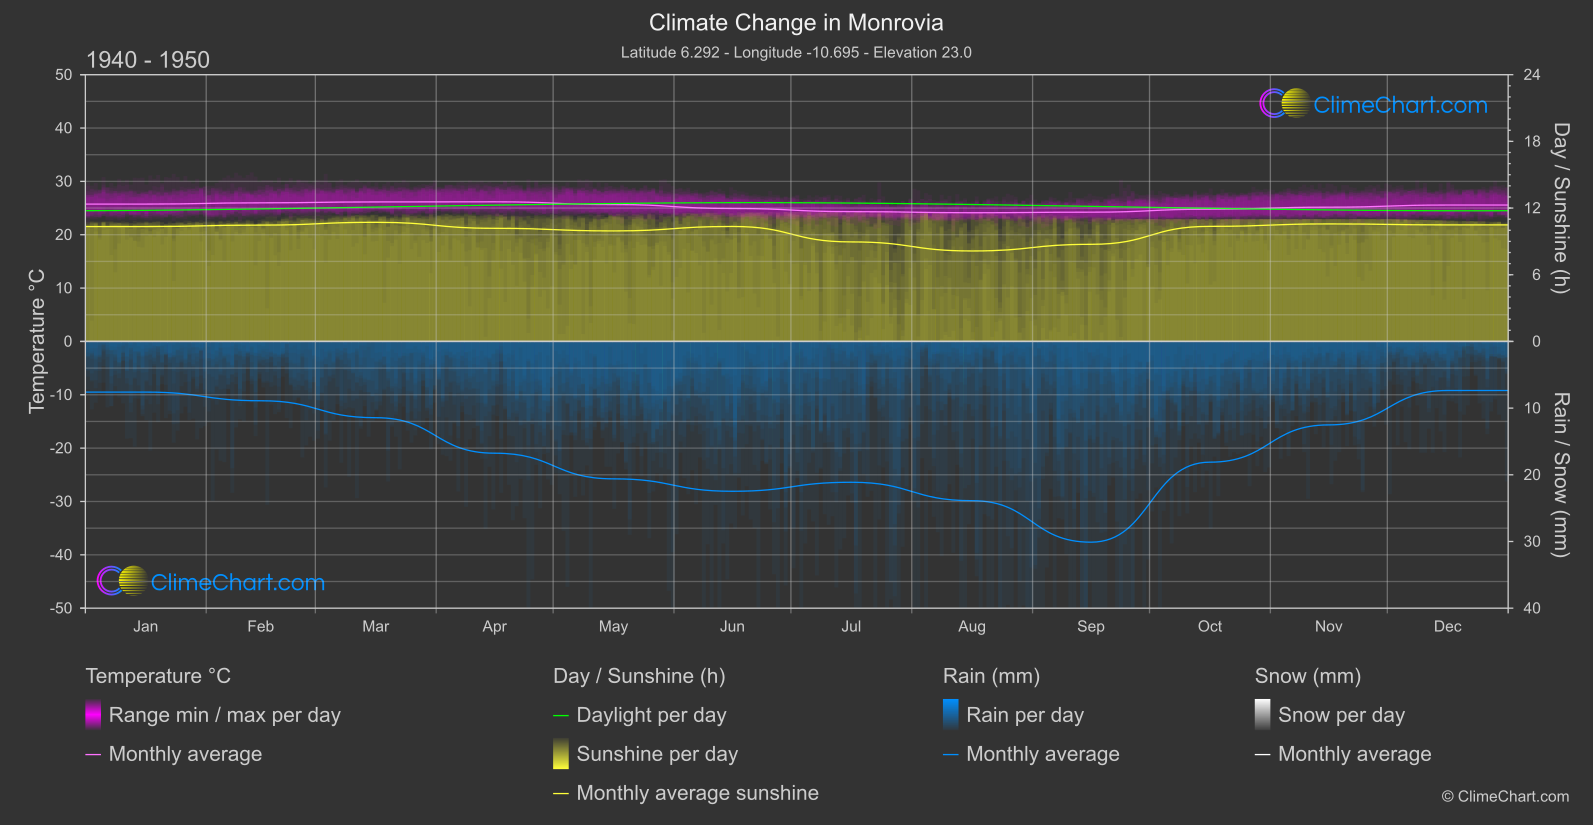
Monrovia, the capital of Liberia, experiences noticeable changes in temperature, with an increase seen in most months, especially in December. Rainfall patterns have also shifted over the years, with substantial variations in different months. The sunshine duration has shown a decreasing trend, particularly in the summer months. These changes emphasize the impact of climate change on Monrovia's weather patterns.
Climate Change Data Overview for Monrovia, Liberia
Explore the comprehensive climate change data for Monrovia, Liberia. This detailed table provides valuable insights into temperature variations, precipitation levels, and seasonal changes influenced by climate change, helping you understand the unique weather patterns of this region.
Temperature °C
| Month | ⌀ 1940 - 1950 | ⌀ 2013 - 2023 | +/- |
|---|---|---|---|
| Jan | 25.74 | 26.36 | 0.62 |
| Feb | 25.98 | 26.49 | 0.51 |
| Mar | 26.15 | 26.55 | 0.40 |
| Apr | 26.17 | 26.66 | 0.49 |
| May | 25.66 | 26.04 | 0.38 |
| Jun | 24.92 | 25.13 | 0.21 |
| Jul | 24.33 | 24.77 | 0.44 |
| Aug | 24.12 | 24.59 | 0.46 |
| Sep | 24.23 | 24.69 | 0.46 |
| Oct | 24.79 | 25.19 | 0.40 |
| Nov | 25.17 | 25.52 | 0.36 |
| Dec | 25.57 | 26.12 | 0.55 |
| ⌀ Month | 25.24 | 25.68 | 0.44 |
Sunshine (h)
| Month | ⌀ 1940 - 1950 | ⌀ 2013 - 2023 | +/- |
|---|---|---|---|
| Jan | 10.33 | 9.83 | -0.50 |
| Feb | 10.47 | 9.78 | -0.69 |
| Mar | 10.72 | 9.71 | -1.01 |
| Apr | 10.18 | 9.63 | -0.55 |
| May | 9.94 | 8.55 | -1.40 |
| Jun | 10.34 | 7.72 | -2.62 |
| Jul | 8.95 | 7.59 | -1.36 |
| Aug | 8.14 | 6.91 | -1.23 |
| Sep | 8.74 | 7.21 | -1.53 |
| Oct | 10.35 | 8.87 | -1.48 |
| Nov | 10.57 | 9.68 | -0.89 |
| Dec | 10.48 | 10.07 | -0.41 |
| ⌀ Month | 9.94 | 8.80 | -1.14 |
Rain (mm)
| Month | ⌀ 1940 - 1950 | ⌀ 2013 - 2023 | +/- |
|---|---|---|---|
| Jan | 3.80 | 2.79 | -1.01 |
| Feb | 4.45 | 3.28 | -1.17 |
| Mar | 5.72 | 4.57 | -1.15 |
| Apr | 8.38 | 6.01 | -2.37 |
| May | 10.30 | 11.90 | 1.60 |
| Jun | 11.24 | 18.58 | 7.34 |
| Jul | 10.56 | 13.87 | 3.31 |
| Aug | 11.94 | 17.10 | 5.16 |
| Sep | 15.05 | 18.54 | 3.49 |
| Oct | 9.05 | 11.48 | 2.43 |
| Nov | 6.26 | 6.97 | 0.71 |
| Dec | 3.68 | 2.99 | -0.69 |
| ⌀ Month | 8.37 | 9.84 | 1.47 |
Snow (mm)
| Month | ⌀ 1940 - 1950 | ⌀ 2013 - 2023 | +/- |
|---|---|---|---|
| Jan | 0.00 | 0.00 | 0.00 |
| Feb | 0.00 | 0.00 | 0.00 |
| Mar | 0.00 | 0.00 | 0.00 |
| Apr | 0.00 | 0.00 | 0.00 |
| May | 0.00 | 0.00 | 0.00 |
| Jun | 0.00 | 0.00 | 0.00 |
| Jul | 0.00 | 0.00 | 0.00 |
| Aug | 0.00 | 0.00 | 0.00 |
| Sep | 0.00 | 0.00 | 0.00 |
| Oct | 0.00 | 0.00 | 0.00 |
| Nov | 0.00 | 0.00 | 0.00 |
| Dec | 0.00 | 0.00 | 0.00 |
| ⌀ Month | 0.00 | 0.00 | 0.00 |