Climate Change Chart of Mogadishu, Somalia
Comprehensive Climate Change Chart of Mogadishu, Somalia: Monthly Averages and Impact Trends
Exploring the changing climate in Mogadishu, Somalia reveals intriguing patterns in temperature, rainfall, and sunshine duration.
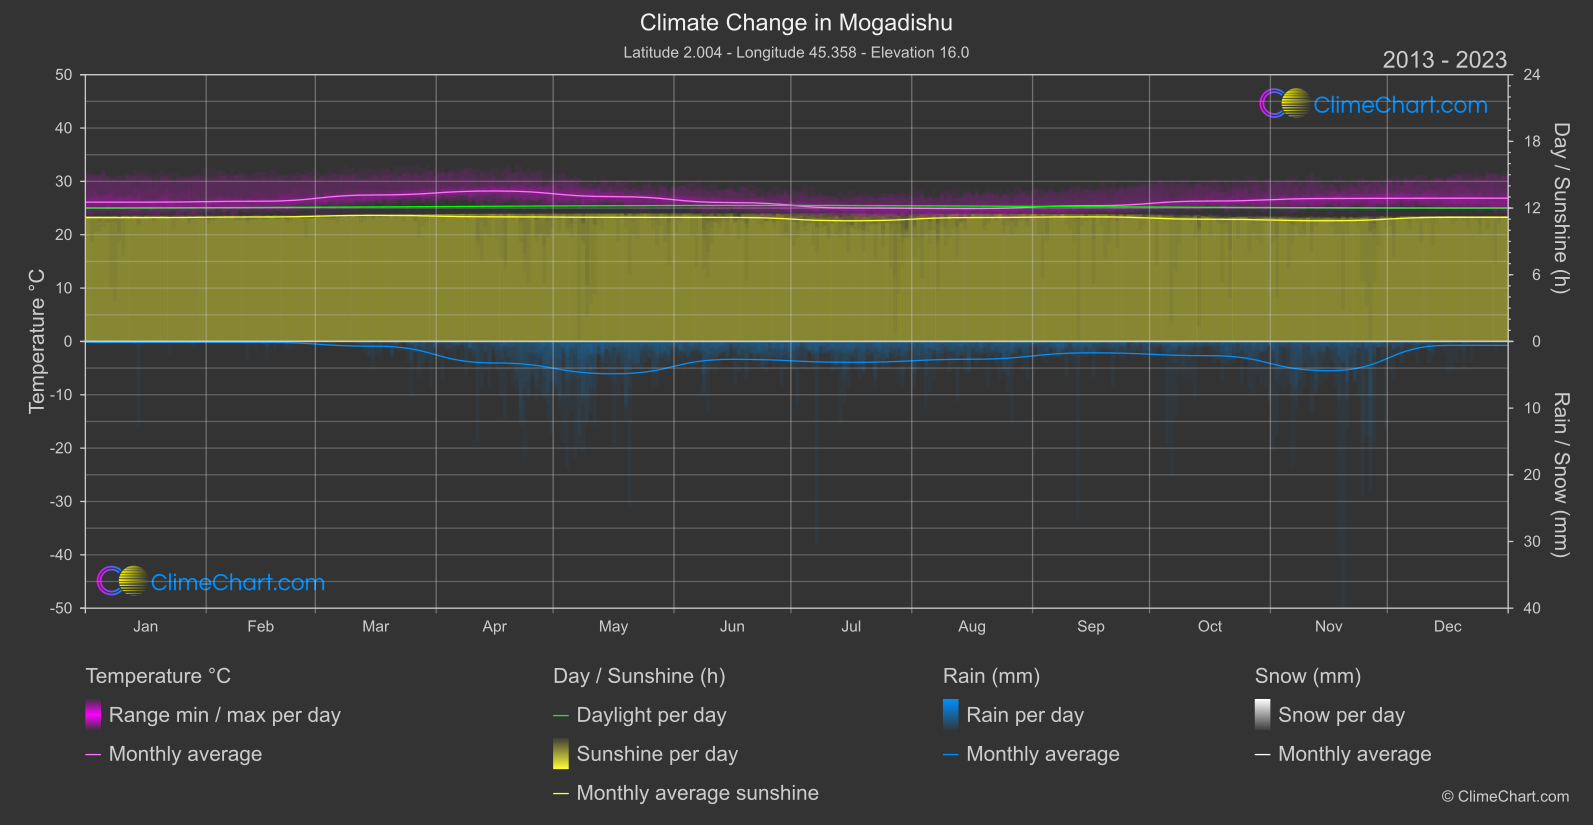
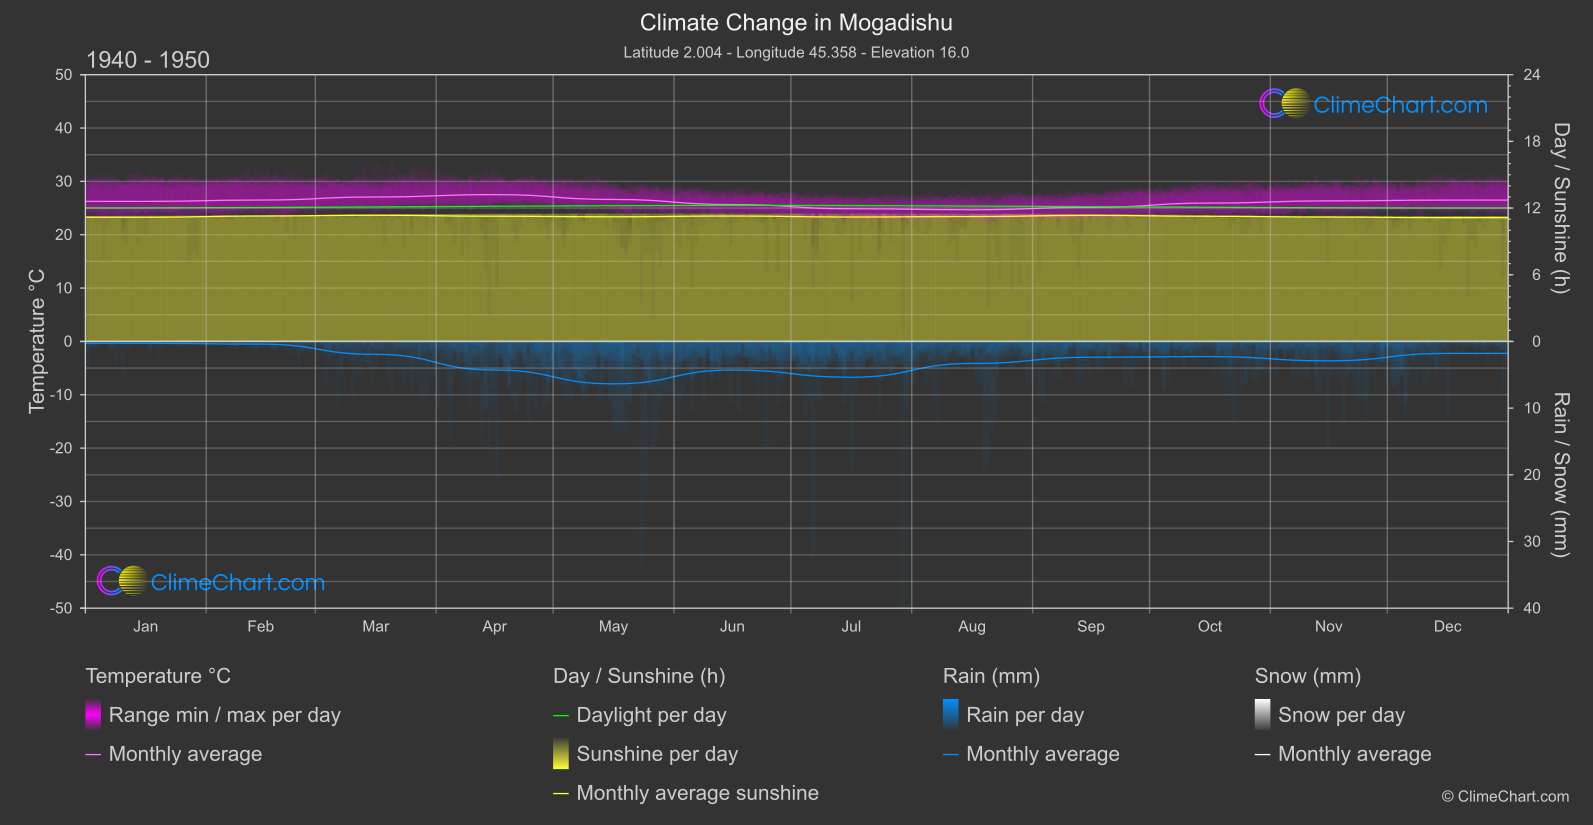
Mogadishu, the capital of Somalia, is experiencing notable changes in climate. From the data analysis, it is evident that the month of April shows the highest increase in temperature compared to the historical period of 1940-1950. Additionally, November exhibits a significant rise in rainfall. These changes in temperature and rainfall patterns can have profound implications on the local ecosystem and livelihoods.
Climate Change Data Overview for Mogadishu, Somalia
Explore the comprehensive climate change data for Mogadishu, Somalia. This detailed table provides valuable insights into temperature variations, precipitation levels, and seasonal changes influenced by climate change, helping you understand the unique weather patterns of this region.
Temperature °C
| Month | ⌀ 1940 - 1950 | ⌀ 2013 - 2023 | +/- |
|---|---|---|---|
| Jan | 26.25 | 26.11 | -0.15 |
| Feb | 26.50 | 26.28 | -0.22 |
| Mar | 27.08 | 27.46 | 0.38 |
| Apr | 27.52 | 28.20 | 0.68 |
| May | 26.61 | 27.14 | 0.53 |
| Jun | 25.65 | 26.02 | 0.37 |
| Jul | 24.87 | 25.01 | 0.14 |
| Aug | 24.68 | 24.91 | 0.23 |
| Sep | 25.13 | 25.44 | 0.31 |
| Oct | 25.94 | 26.32 | 0.38 |
| Nov | 26.34 | 26.79 | 0.45 |
| Dec | 26.49 | 26.85 | 0.36 |
| ⌀ Month | 26.09 | 26.38 | 0.29 |
Sunshine (h)
| Month | ⌀ 1940 - 1950 | ⌀ 2013 - 2023 | +/- |
|---|---|---|---|
| Jan | 11.17 | 11.14 | -0.03 |
| Feb | 11.28 | 11.20 | -0.08 |
| Mar | 11.35 | 11.34 | -0.01 |
| Apr | 11.26 | 11.21 | -0.05 |
| May | 11.22 | 11.17 | -0.05 |
| Jun | 11.28 | 11.16 | -0.12 |
| Jul | 11.19 | 10.85 | -0.34 |
| Aug | 11.24 | 11.15 | -0.09 |
| Sep | 11.34 | 11.21 | -0.13 |
| Oct | 11.26 | 10.99 | -0.27 |
| Nov | 11.19 | 10.86 | -0.33 |
| Dec | 11.13 | 11.16 | 0.03 |
| ⌀ Month | 11.24 | 11.12 | -0.12 |
Rain (mm)
| Month | ⌀ 1940 - 1950 | ⌀ 2013 - 2023 | +/- |
|---|---|---|---|
| Jan | 0.14 | 0.06 | -0.08 |
| Feb | 0.20 | 0.06 | -0.14 |
| Mar | 0.97 | 0.36 | -0.61 |
| Apr | 2.14 | 1.61 | -0.53 |
| May | 3.18 | 2.43 | -0.75 |
| Jun | 2.14 | 1.34 | -0.80 |
| Jul | 2.69 | 1.57 | -1.12 |
| Aug | 1.65 | 1.34 | -0.32 |
| Sep | 1.19 | 0.85 | -0.33 |
| Oct | 1.14 | 1.07 | -0.07 |
| Nov | 1.45 | 2.19 | 0.74 |
| Dec | 0.90 | 0.30 | -0.60 |
| ⌀ Month | 1.48 | 1.10 | -0.38 |
Snow (mm)
| Month | ⌀ 1940 - 1950 | ⌀ 2013 - 2023 | +/- |
|---|---|---|---|
| Jan | 0.00 | 0.00 | 0.00 |
| Feb | 0.00 | 0.00 | 0.00 |
| Mar | 0.00 | 0.00 | 0.00 |
| Apr | 0.00 | 0.00 | 0.00 |
| May | 0.00 | 0.00 | 0.00 |
| Jun | 0.00 | 0.00 | 0.00 |
| Jul | 0.00 | 0.00 | 0.00 |
| Aug | 0.00 | 0.00 | 0.00 |
| Sep | 0.00 | 0.00 | 0.00 |
| Oct | 0.00 | 0.00 | 0.00 |
| Nov | 0.00 | 0.00 | 0.00 |
| Dec | 0.00 | 0.00 | 0.00 |
| ⌀ Month | 0.00 | 0.00 | 0.00 |