Climate Change Chart of Megève, France
Comprehensive Climate Change Chart of Megève, France: Monthly Averages and Impact Trends
Explore the changing climate in Megève, France, through detailed data analysis. Discover insights on temperature, rainfall, snowfall, and sunshine duration trends over decades.
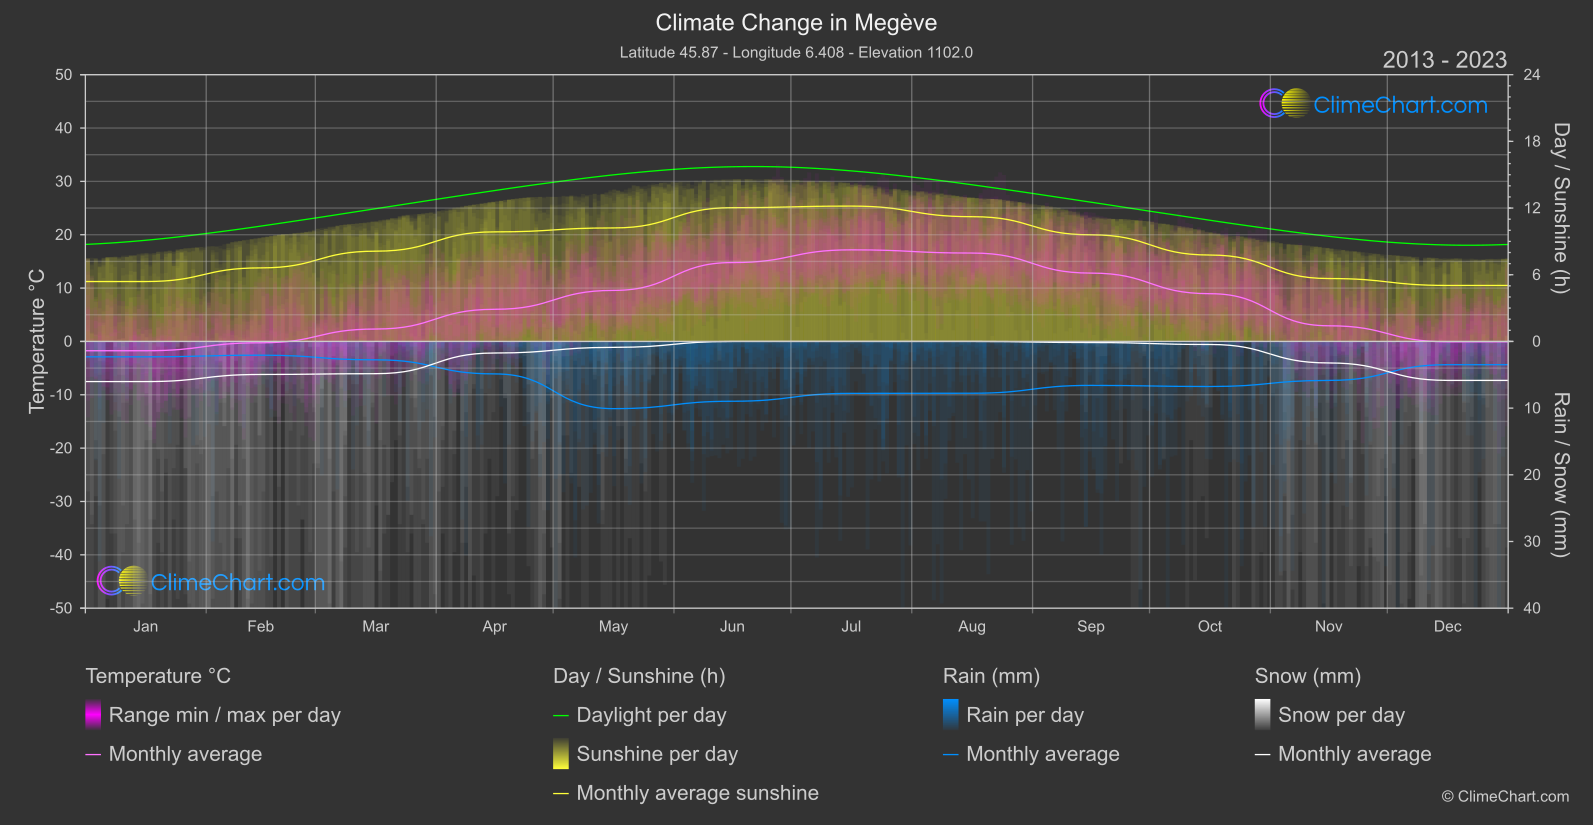
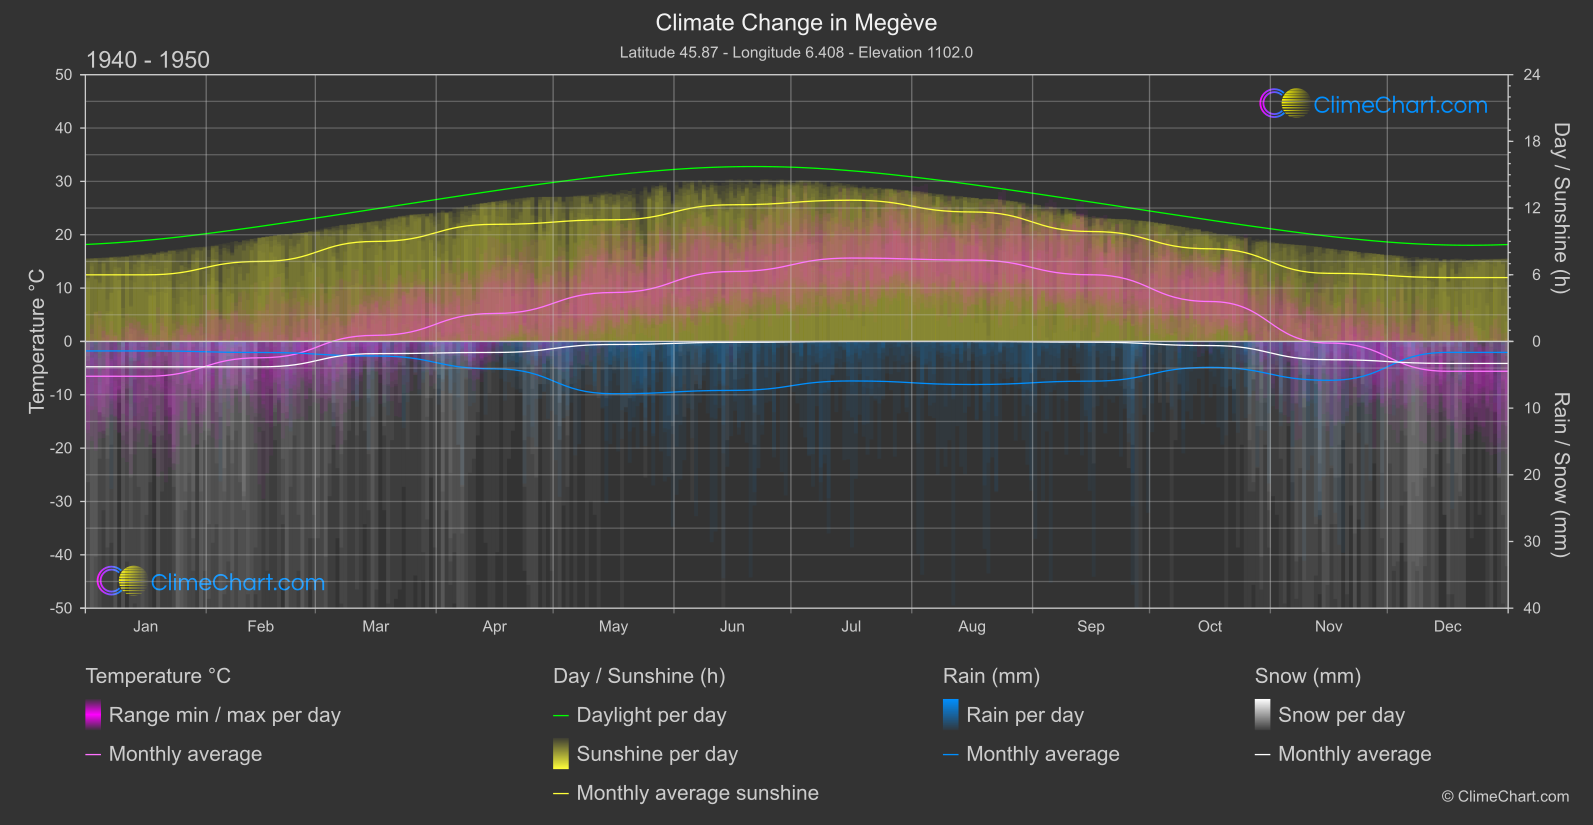
Megève, a charming town in the French Alps, has witnessed significant climate changes over the decades. The data showcases how temperatures have increased, rainfall patterns have shifted, snowfall has fluctuated, and sunshine duration has varied. In particular, the data reveals that December experienced the highest temperature rise of 5.52°C compared to the past, while October saw the most significant increase in rainfall by 1.44mm. Snowfall in Megève has shown varying trends, with March having the highest difference of 1.50mm between the two periods. Furthermore, the duration of sunshine has slightly decreased in most months, notably in August with a reduction of 0.43 hours.
Climate Change Data Overview for Megève, France
Explore the comprehensive climate change data for Megève, France. This detailed table provides valuable insights into temperature variations, precipitation levels, and seasonal changes influenced by climate change, helping you understand the unique weather patterns of this region.
Temperature °C
| Month | ⌀ 1940 - 1950 | ⌀ 2013 - 2023 | +/- |
|---|---|---|---|
| Jan | -6.53 | -1.74 | 4.79 |
| Feb | -3.06 | -0.26 | 2.80 |
| Mar | 1.14 | 2.32 | 1.18 |
| Apr | 5.24 | 6.02 | 0.78 |
| May | 9.17 | 9.56 | 0.39 |
| Jun | 13.11 | 14.78 | 1.67 |
| Jul | 15.63 | 17.17 | 1.54 |
| Aug | 15.25 | 16.57 | 1.31 |
| Sep | 12.49 | 12.81 | 0.32 |
| Oct | 7.49 | 8.95 | 1.46 |
| Nov | -0.30 | 2.93 | 3.24 |
| Dec | -5.59 | -0.07 | 5.52 |
| ⌀ Month | 5.34 | 7.42 | 2.08 |
Sunshine (h)
| Month | ⌀ 1940 - 1950 | ⌀ 2013 - 2023 | +/- |
|---|---|---|---|
| Jan | 5.99 | 5.39 | -0.60 |
| Feb | 7.20 | 6.62 | -0.58 |
| Mar | 9.00 | 8.12 | -0.88 |
| Apr | 10.54 | 9.86 | -0.68 |
| May | 10.95 | 10.21 | -0.73 |
| Jun | 12.30 | 12.04 | -0.26 |
| Jul | 12.71 | 12.18 | -0.53 |
| Aug | 11.65 | 11.22 | -0.43 |
| Sep | 9.89 | 9.59 | -0.30 |
| Oct | 8.34 | 7.77 | -0.56 |
| Nov | 6.13 | 5.66 | -0.47 |
| Dec | 5.75 | 5.04 | -0.71 |
| ⌀ Month | 9.20 | 8.64 | -0.56 |
Rain (mm)
| Month | ⌀ 1940 - 1950 | ⌀ 2013 - 2023 | +/- |
|---|---|---|---|
| Jan | 0.71 | 1.15 | 0.44 |
| Feb | 0.83 | 1.03 | 0.20 |
| Mar | 1.09 | 1.38 | 0.29 |
| Apr | 2.06 | 2.43 | 0.38 |
| May | 3.92 | 5.04 | 1.12 |
| Jun | 3.67 | 4.48 | 0.81 |
| Jul | 2.96 | 3.89 | 0.93 |
| Aug | 3.23 | 3.88 | 0.66 |
| Sep | 2.98 | 3.30 | 0.32 |
| Oct | 1.94 | 3.38 | 1.44 |
| Nov | 2.91 | 2.92 | 0.01 |
| Dec | 0.82 | 1.75 | 0.92 |
| ⌀ Month | 2.26 | 2.89 | 0.63 |
Snow (mm)
| Month | ⌀ 1940 - 1950 | ⌀ 2013 - 2023 | +/- |
|---|---|---|---|
| Jan | 1.90 | 3.01 | 1.11 |
| Feb | 1.90 | 2.48 | 0.57 |
| Mar | 0.91 | 2.42 | 1.50 |
| Apr | 0.83 | 0.87 | 0.04 |
| May | 0.23 | 0.44 | 0.22 |
| Jun | 0.07 | 0.00 | -0.07 |
| Jul | 0.00 | 0.00 | 0.00 |
| Aug | 0.00 | 0.00 | -0.00 |
| Sep | 0.05 | 0.08 | 0.03 |
| Oct | 0.31 | 0.23 | -0.08 |
| Nov | 1.37 | 1.61 | 0.24 |
| Dec | 1.65 | 2.92 | 1.27 |
| ⌀ Month | 0.77 | 1.17 | 0.40 |