Climate Change Chart of Malmö, Sweden
Comprehensive Climate Change Chart of Malmö, Sweden: Monthly Averages and Impact Trends
Exploring the climate change in Malmö, Sweden reveals intriguing insights into the temperature, rainfall, snowfall, and sunshine duration over the years.
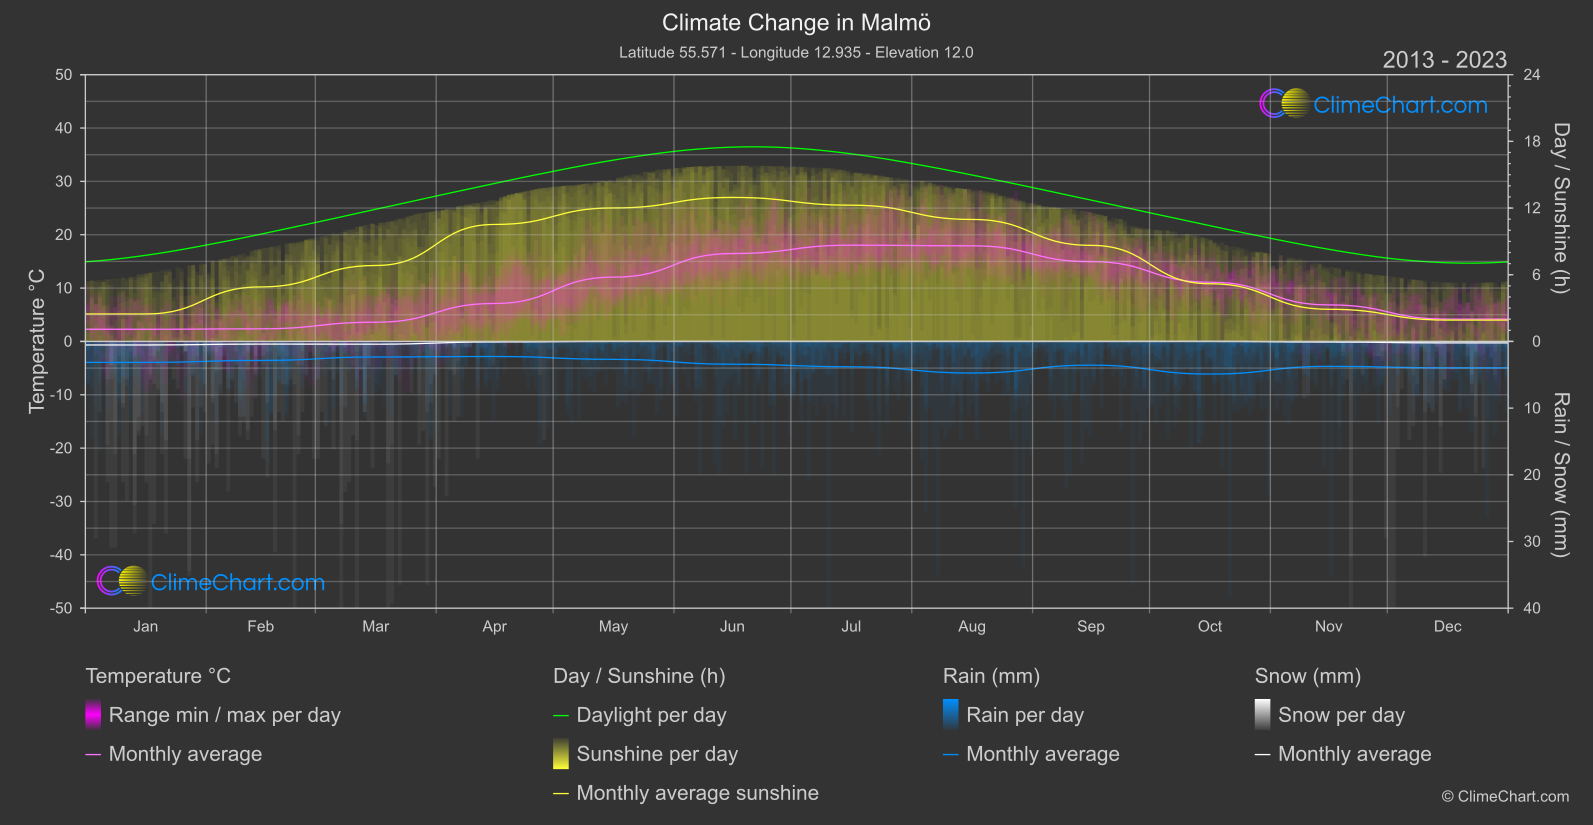
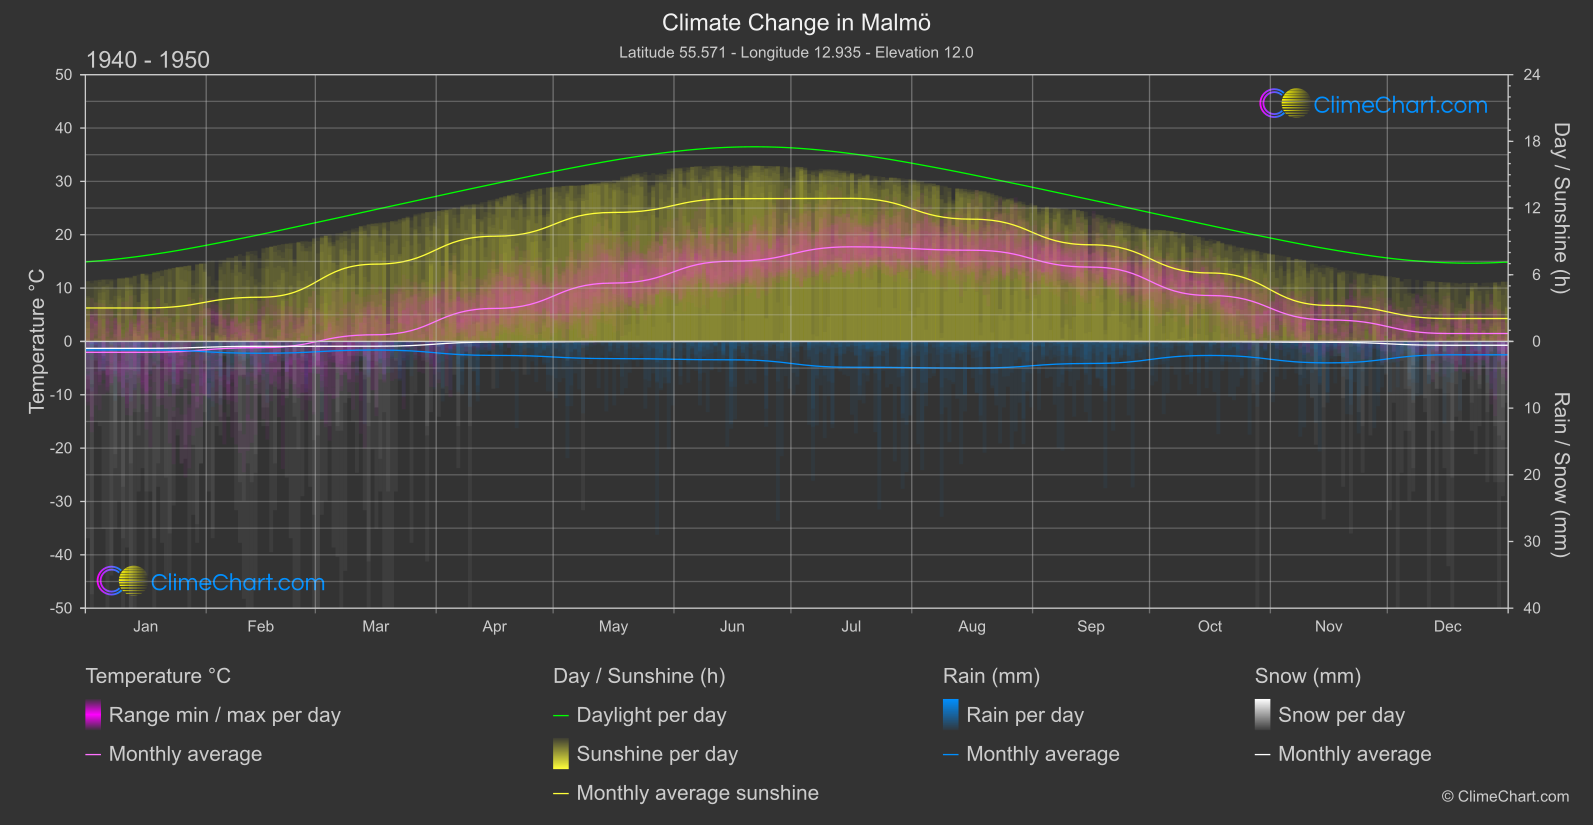
Malmö, Sweden, has experienced significant changes in its climate over the years. The data shows a noticeable increase in temperatures across most months, with October exhibiting the highest temperature change. Rainfall patterns have also evolved, with October showing a substantial increase in rainfall. Snowfall has decreased in many months, indicating a shift in precipitation trends. Additionally, sunshine duration has fluctuated, with May having the highest change in sunshine hours.
Climate Change Data Overview for Malmö, Sweden
Explore the comprehensive climate change data for Malmö, Sweden. This detailed table provides valuable insights into temperature variations, precipitation levels, and seasonal changes influenced by climate change, helping you understand the unique weather patterns of this region.
Temperature °C
| Month | ⌀ 1940 - 1950 | ⌀ 2013 - 2023 | +/- |
|---|---|---|---|
| Jan | -2.04 | 2.28 | 4.32 |
| Feb | -1.16 | 2.36 | 3.52 |
| Mar | 1.25 | 3.60 | 2.35 |
| Apr | 6.19 | 7.12 | 0.93 |
| May | 10.94 | 12.05 | 1.11 |
| Jun | 15.04 | 16.47 | 1.43 |
| Jul | 17.74 | 18.04 | 0.31 |
| Aug | 17.10 | 17.92 | 0.83 |
| Sep | 13.94 | 14.96 | 1.02 |
| Oct | 8.61 | 11.10 | 2.49 |
| Nov | 4.03 | 6.85 | 2.82 |
| Dec | 1.49 | 4.18 | 2.70 |
| ⌀ Month | 7.76 | 9.74 | 1.99 |
Sunshine (h)
| Month | ⌀ 1940 - 1950 | ⌀ 2013 - 2023 | +/- |
|---|---|---|---|
| Jan | 3.01 | 2.47 | -0.54 |
| Feb | 3.98 | 4.90 | 0.92 |
| Mar | 6.95 | 6.83 | -0.12 |
| Apr | 9.47 | 10.53 | 1.06 |
| May | 11.61 | 12.01 | 0.40 |
| Jun | 12.84 | 12.96 | 0.11 |
| Jul | 12.87 | 12.26 | -0.62 |
| Aug | 11.00 | 10.98 | -0.02 |
| Sep | 8.70 | 8.64 | -0.05 |
| Oct | 6.16 | 5.19 | -0.97 |
| Nov | 3.24 | 2.89 | -0.35 |
| Dec | 2.06 | 1.92 | -0.14 |
| ⌀ Month | 7.66 | 7.63 | -0.03 |
Rain (mm)
| Month | ⌀ 1940 - 1950 | ⌀ 2013 - 2023 | +/- |
|---|---|---|---|
| Jan | 0.64 | 1.57 | 0.93 |
| Feb | 0.89 | 1.43 | 0.54 |
| Mar | 0.65 | 1.17 | 0.52 |
| Apr | 1.05 | 1.13 | 0.08 |
| May | 1.29 | 1.34 | 0.05 |
| Jun | 1.38 | 1.71 | 0.33 |
| Jul | 1.93 | 1.90 | -0.03 |
| Aug | 2.00 | 2.37 | 0.37 |
| Sep | 1.65 | 1.78 | 0.13 |
| Oct | 1.05 | 2.45 | 1.39 |
| Nov | 1.61 | 1.87 | 0.26 |
| Dec | 1.00 | 1.98 | 0.98 |
| ⌀ Month | 1.26 | 1.72 | 0.46 |
Snow (mm)
| Month | ⌀ 1940 - 1950 | ⌀ 2013 - 2023 | +/- |
|---|---|---|---|
| Jan | 0.52 | 0.26 | -0.25 |
| Feb | 0.37 | 0.20 | -0.17 |
| Mar | 0.36 | 0.21 | -0.15 |
| Apr | 0.05 | 0.04 | -0.01 |
| May | 0.01 | 0.00 | -0.01 |
| Jun | 0.00 | 0.00 | 0.00 |
| Jul | 0.00 | 0.00 | 0.00 |
| Aug | 0.00 | 0.00 | 0.00 |
| Sep | 0.00 | 0.00 | 0.00 |
| Oct | 0.02 | 0.00 | -0.02 |
| Nov | 0.07 | 0.04 | -0.02 |
| Dec | 0.29 | 0.11 | -0.18 |
| ⌀ Month | 0.14 | 0.07 | -0.07 |