Climate Change Chart of Malabo, Equatorial Guinea
Comprehensive Climate Change Chart of Malabo, Equatorial Guinea: Monthly Averages and Impact Trends
Explore the changing climate in Malabo, Equatorial Guinea with detailed insights on temperature, rainfall, and sunshine duration.
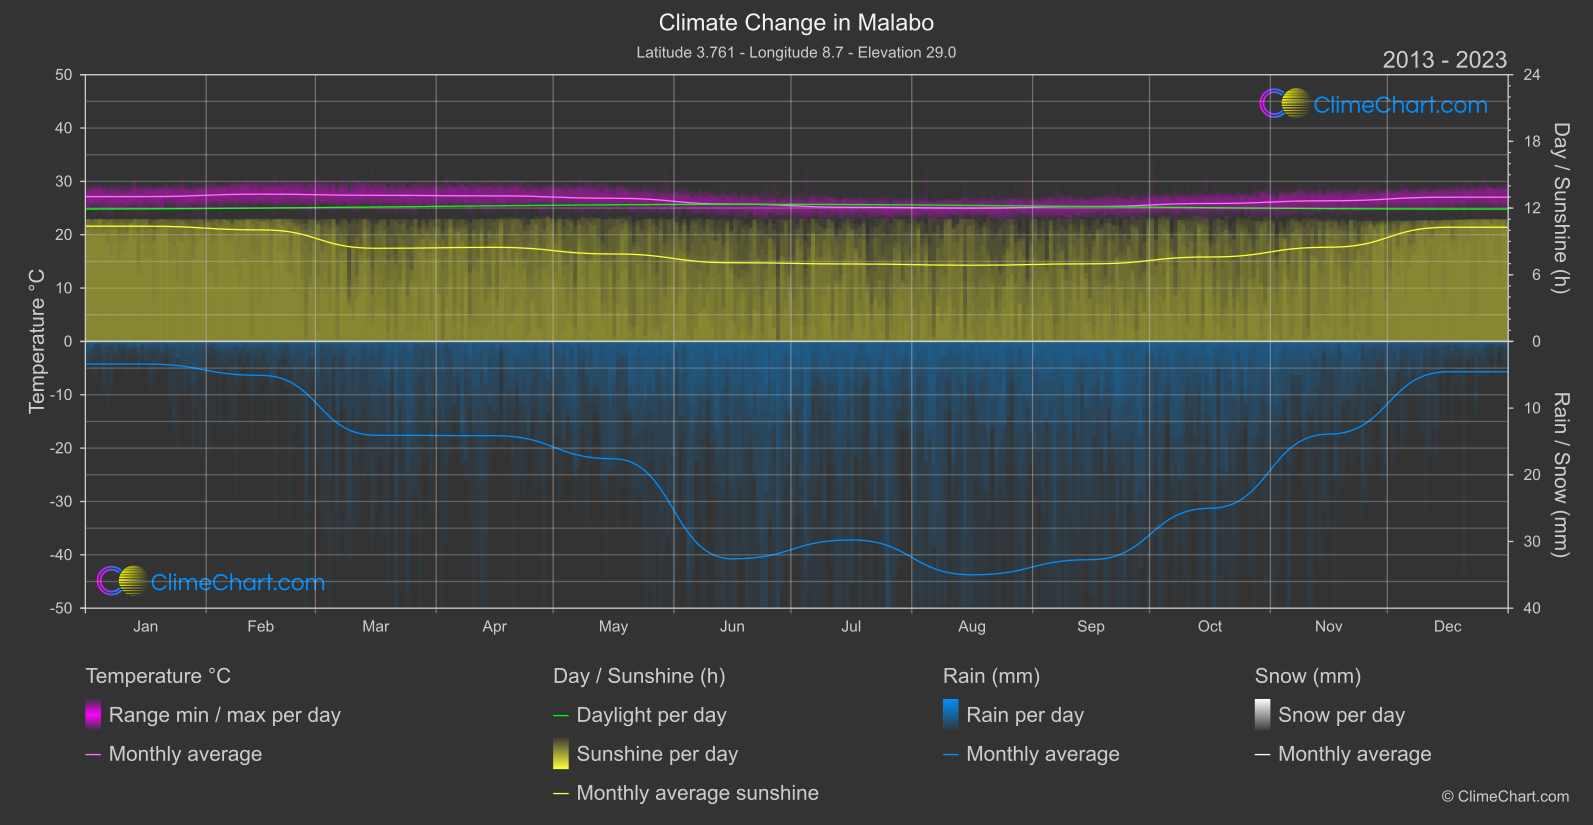
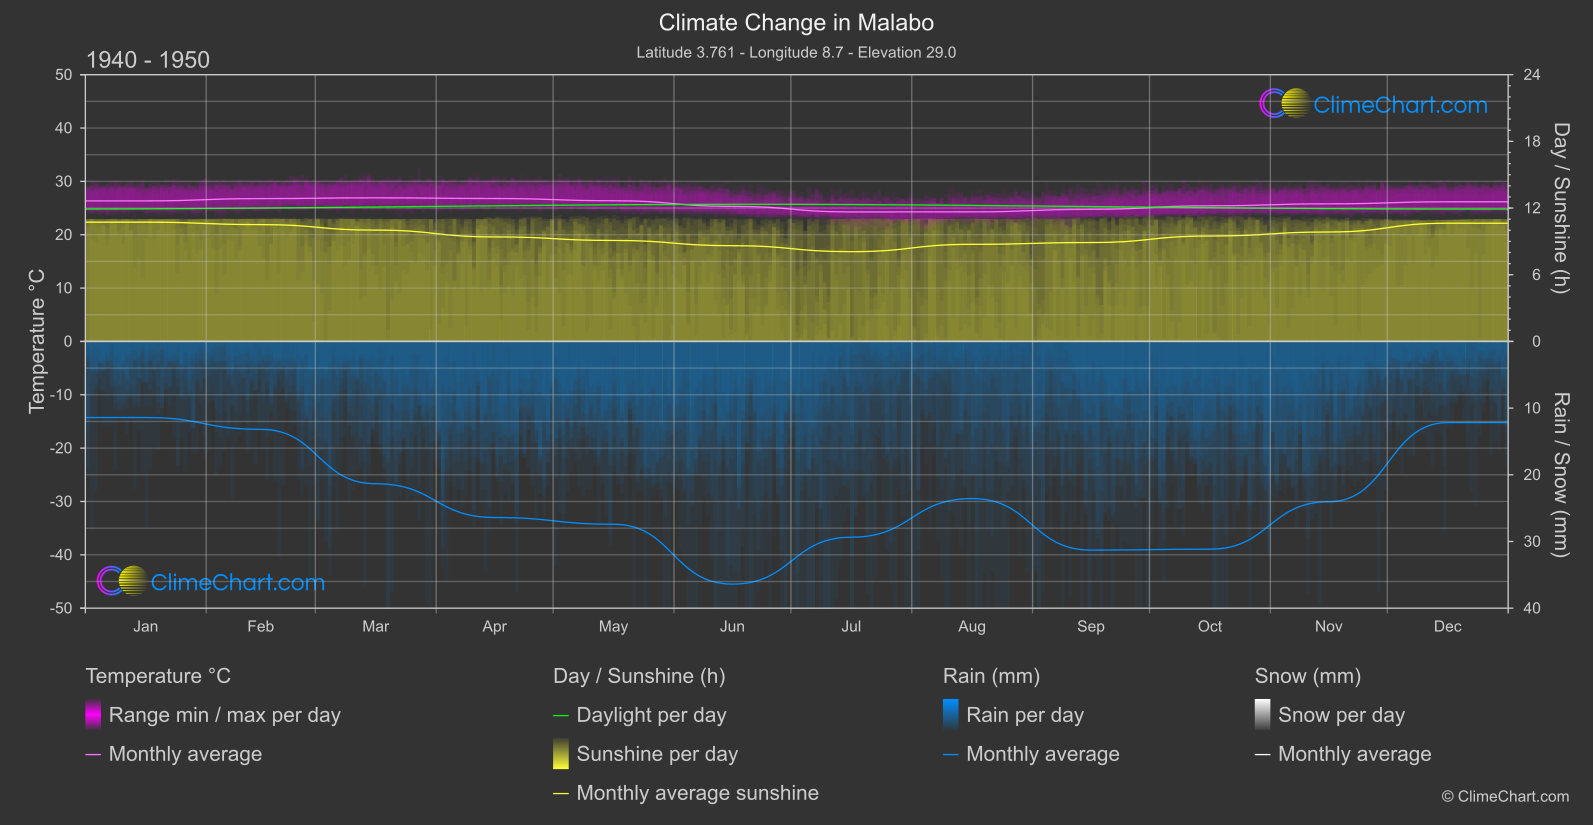
Malabo, Equatorial Guinea, experiences varying climate changes with temperature, rainfall, and sunshine duration showing significant fluctuations over the years. The data from 1940 to 1950 compared to 2013 to 2024 reveals interesting patterns. For temperature, months like July and December exhibit notable increases in mean temperature, while for rainfall, August experiences a substantial rise in precipitation. Sunshine duration also demonstrates shifts, with months like March and June showing considerable decreases in hours of sunlight.
Climate Change Data Overview for Malabo, Equatorial Guinea
Explore the comprehensive climate change data for Malabo, Equatorial Guinea. This detailed table provides valuable insights into temperature variations, precipitation levels, and seasonal changes influenced by climate change, helping you understand the unique weather patterns of this region.
Temperature °C
| Month | ⌀ 1940 - 1950 | ⌀ 2013 - 2023 | +/- |
|---|---|---|---|
| Jan | 26.34 | 27.15 | 0.80 |
| Feb | 26.77 | 27.60 | 0.83 |
| Mar | 26.92 | 27.39 | 0.47 |
| Apr | 26.79 | 27.28 | 0.50 |
| May | 26.37 | 26.83 | 0.46 |
| Jun | 25.32 | 25.73 | 0.42 |
| Jul | 24.27 | 25.15 | 0.87 |
| Aug | 24.29 | 25.00 | 0.72 |
| Sep | 24.76 | 25.29 | 0.53 |
| Oct | 25.42 | 25.86 | 0.44 |
| Nov | 25.79 | 26.37 | 0.57 |
| Dec | 26.17 | 27.03 | 0.86 |
| ⌀ Month | 25.77 | 26.39 | 0.62 |
Sunshine (h)
| Month | ⌀ 1940 - 1950 | ⌀ 2013 - 2023 | +/- |
|---|---|---|---|
| Jan | 10.73 | 10.37 | -0.36 |
| Feb | 10.51 | 10.04 | -0.47 |
| Mar | 10.01 | 8.38 | -1.63 |
| Apr | 9.40 | 8.46 | -0.94 |
| May | 9.09 | 7.87 | -1.22 |
| Jun | 8.61 | 7.08 | -1.53 |
| Jul | 8.08 | 6.97 | -1.11 |
| Aug | 8.74 | 6.86 | -1.88 |
| Sep | 8.90 | 6.98 | -1.91 |
| Oct | 9.49 | 7.60 | -1.89 |
| Nov | 9.85 | 8.47 | -1.37 |
| Dec | 10.64 | 10.27 | -0.37 |
| ⌀ Month | 9.50 | 8.28 | -1.22 |
Rain (mm)
| Month | ⌀ 1940 - 1950 | ⌀ 2013 - 2023 | +/- |
|---|---|---|---|
| Jan | 5.71 | 1.70 | -4.01 |
| Feb | 6.59 | 2.54 | -4.05 |
| Mar | 10.67 | 7.04 | -3.63 |
| Apr | 13.20 | 7.07 | -6.13 |
| May | 13.71 | 8.80 | -4.91 |
| Jun | 18.20 | 16.30 | -1.89 |
| Jul | 14.68 | 14.88 | 0.21 |
| Aug | 11.78 | 17.50 | 5.72 |
| Sep | 15.65 | 16.36 | 0.71 |
| Oct | 15.58 | 12.51 | -3.06 |
| Nov | 12.02 | 6.95 | -5.07 |
| Dec | 6.08 | 2.27 | -3.81 |
| ⌀ Month | 11.99 | 9.49 | -2.49 |
Snow (mm)
| Month | ⌀ 1940 - 1950 | ⌀ 2013 - 2023 | +/- |
|---|---|---|---|
| Jan | 0.00 | 0.00 | 0.00 |
| Feb | 0.00 | 0.00 | 0.00 |
| Mar | 0.00 | 0.00 | 0.00 |
| Apr | 0.00 | 0.00 | 0.00 |
| May | 0.00 | 0.00 | 0.00 |
| Jun | 0.00 | 0.00 | 0.00 |
| Jul | 0.00 | 0.00 | 0.00 |
| Aug | 0.00 | 0.00 | 0.00 |
| Sep | 0.00 | 0.00 | 0.00 |
| Oct | 0.00 | 0.00 | 0.00 |
| Nov | 0.00 | 0.00 | 0.00 |
| Dec | 0.00 | 0.00 | 0.00 |
| ⌀ Month | 0.00 | 0.00 | 0.00 |