Climate Change Chart of Madrid, Spain
Comprehensive Climate Change Chart of Madrid, Spain: Monthly Averages and Impact Trends
Explore the changing climate in Madrid, Spain with insights from temperature, rainfall, snowfall, and sunshine duration data. Discover how the climate trends have evolved from 1940 to 1950 compared to 2013 to 2024.
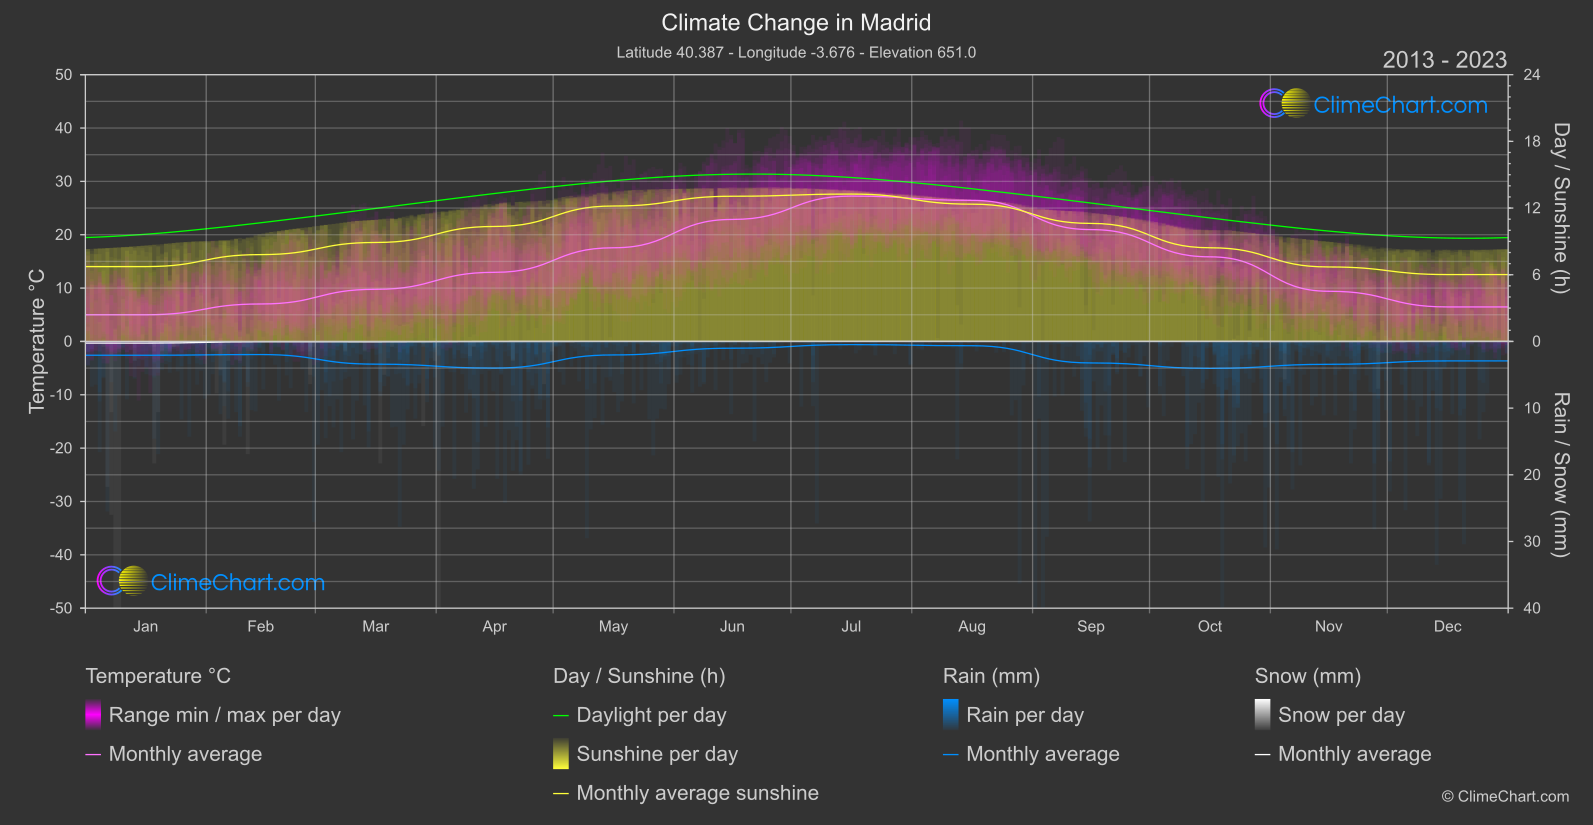
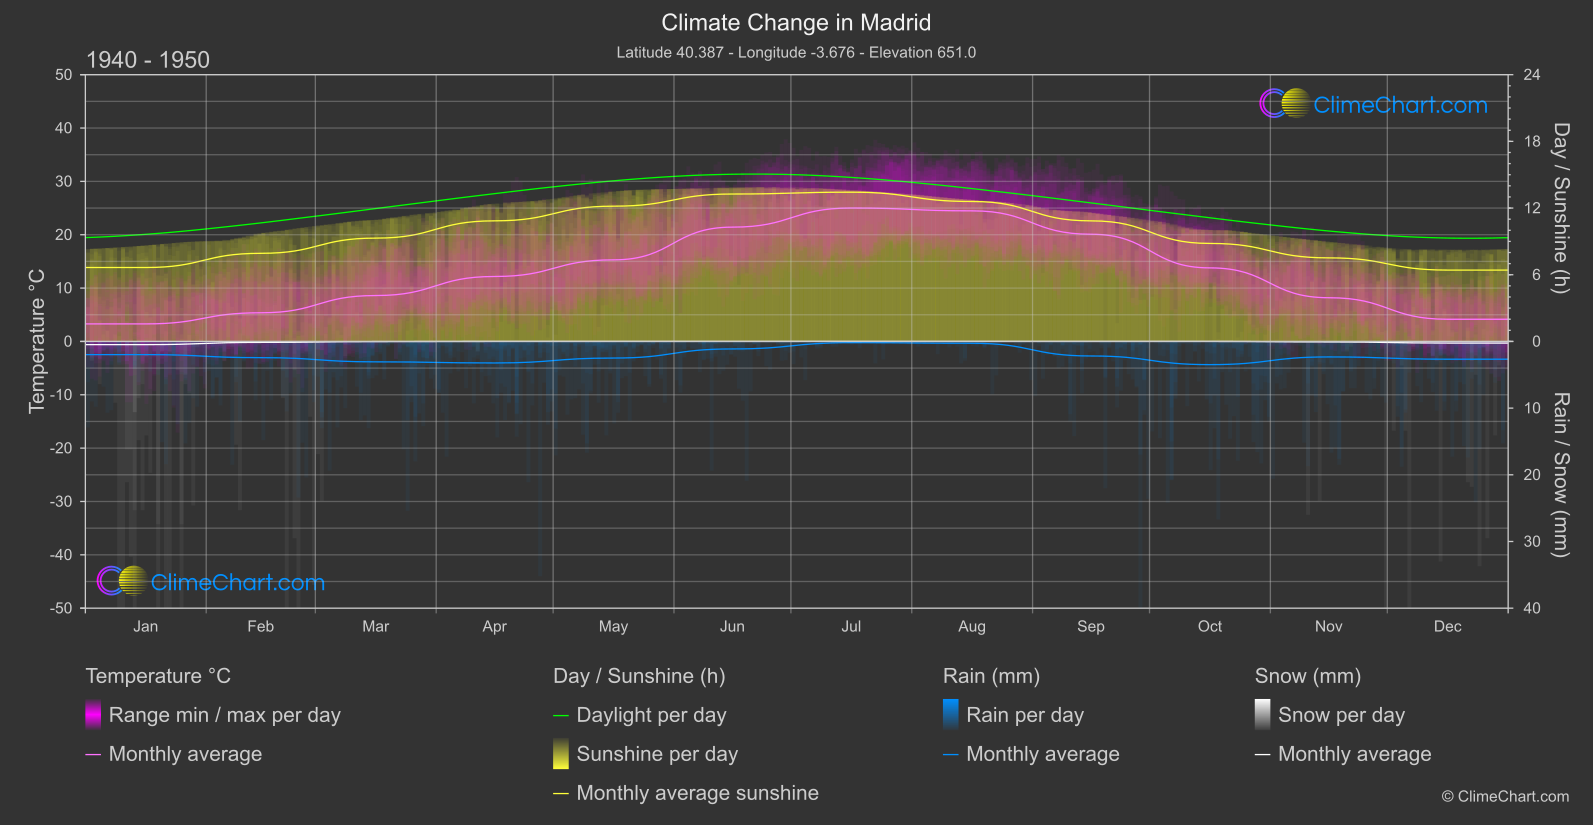
Madrid, the capital of Spain, experiences significant changes in climate parameters such as temperature, rainfall, snowfall, and sunshine duration. Analysis of the data from the years 1940 to 1950 and 2013 to 2024 reveals interesting insights. For example, May shows a notable increase in temperature by 2.26°C, while September experiences a rise in rainfall by 0.52mm. Furthermore, the sunshine duration in November has decreased by 0.82 hours compared to the past.
Climate Change Data Overview for Madrid, Spain
Explore the comprehensive climate change data for Madrid, Spain. This detailed table provides valuable insights into temperature variations, precipitation levels, and seasonal changes influenced by climate change, helping you understand the unique weather patterns of this region.
Temperature °C
| Month | ⌀ 1940 - 1950 | ⌀ 2013 - 2023 | +/- |
|---|---|---|---|
| Jan | 3.29 | 5.00 | 1.71 |
| Feb | 5.37 | 7.02 | 1.65 |
| Mar | 8.60 | 9.77 | 1.17 |
| Apr | 12.17 | 12.95 | 0.78 |
| May | 15.29 | 17.56 | 2.26 |
| Jun | 21.42 | 22.87 | 1.44 |
| Jul | 25.01 | 27.24 | 2.23 |
| Aug | 24.48 | 26.44 | 1.97 |
| Sep | 20.09 | 20.96 | 0.87 |
| Oct | 13.79 | 15.86 | 2.07 |
| Nov | 8.19 | 9.40 | 1.21 |
| Dec | 4.15 | 6.47 | 2.31 |
| ⌀ Month | 13.49 | 15.13 | 1.64 |
Sunshine (h)
| Month | ⌀ 1940 - 1950 | ⌀ 2013 - 2023 | +/- |
|---|---|---|---|
| Jan | 6.65 | 6.73 | 0.08 |
| Feb | 7.93 | 7.81 | -0.12 |
| Mar | 9.30 | 8.90 | -0.39 |
| Apr | 10.85 | 10.34 | -0.51 |
| May | 12.17 | 12.18 | 0.02 |
| Jun | 13.26 | 13.06 | -0.20 |
| Jul | 13.43 | 13.26 | -0.17 |
| Aug | 12.59 | 12.35 | -0.24 |
| Sep | 10.85 | 10.62 | -0.23 |
| Oct | 8.82 | 8.43 | -0.39 |
| Nov | 7.52 | 6.70 | -0.82 |
| Dec | 6.42 | 6.02 | -0.40 |
| ⌀ Month | 9.98 | 9.70 | -0.28 |
Rain (mm)
| Month | ⌀ 1940 - 1950 | ⌀ 2013 - 2023 | +/- |
|---|---|---|---|
| Jan | 0.99 | 1.04 | 0.05 |
| Feb | 1.22 | 0.98 | -0.23 |
| Mar | 1.53 | 1.70 | 0.17 |
| Apr | 1.61 | 2.00 | 0.38 |
| May | 1.25 | 1.01 | -0.23 |
| Jun | 0.56 | 0.51 | -0.06 |
| Jul | 0.09 | 0.24 | 0.15 |
| Aug | 0.14 | 0.32 | 0.18 |
| Sep | 1.09 | 1.61 | 0.52 |
| Oct | 1.74 | 2.02 | 0.28 |
| Nov | 1.16 | 1.71 | 0.55 |
| Dec | 1.33 | 1.46 | 0.13 |
| ⌀ Month | 1.06 | 1.22 | 0.16 |
Snow (mm)
| Month | ⌀ 1940 - 1950 | ⌀ 2013 - 2023 | +/- |
|---|---|---|---|
| Jan | 0.24 | 0.12 | -0.11 |
| Feb | 0.07 | 0.02 | -0.05 |
| Mar | 0.01 | 0.03 | 0.01 |
| Apr | 0.00 | 0.00 | 0.00 |
| May | 0.00 | 0.00 | 0.00 |
| Jun | 0.00 | 0.00 | 0.00 |
| Jul | 0.00 | 0.00 | 0.00 |
| Aug | 0.00 | 0.00 | 0.00 |
| Sep | 0.00 | 0.00 | 0.00 |
| Oct | 0.00 | 0.00 | 0.00 |
| Nov | 0.04 | 0.00 | -0.03 |
| Dec | 0.12 | 0.00 | -0.12 |
| ⌀ Month | 0.04 | 0.02 | -0.03 |