Climate Change Chart of Madonna di Campiglio, Italy
Comprehensive Climate Change Chart of Madonna di Campiglio, Italy: Monthly Averages and Impact Trends
Explore the changing climate in Madonna di Campiglio, Italy through insightful data analysis. Discover how temperature, rainfall, snowfall, and sunshine duration have evolved from 1940 to 1950 compared to 2013 to 2024.

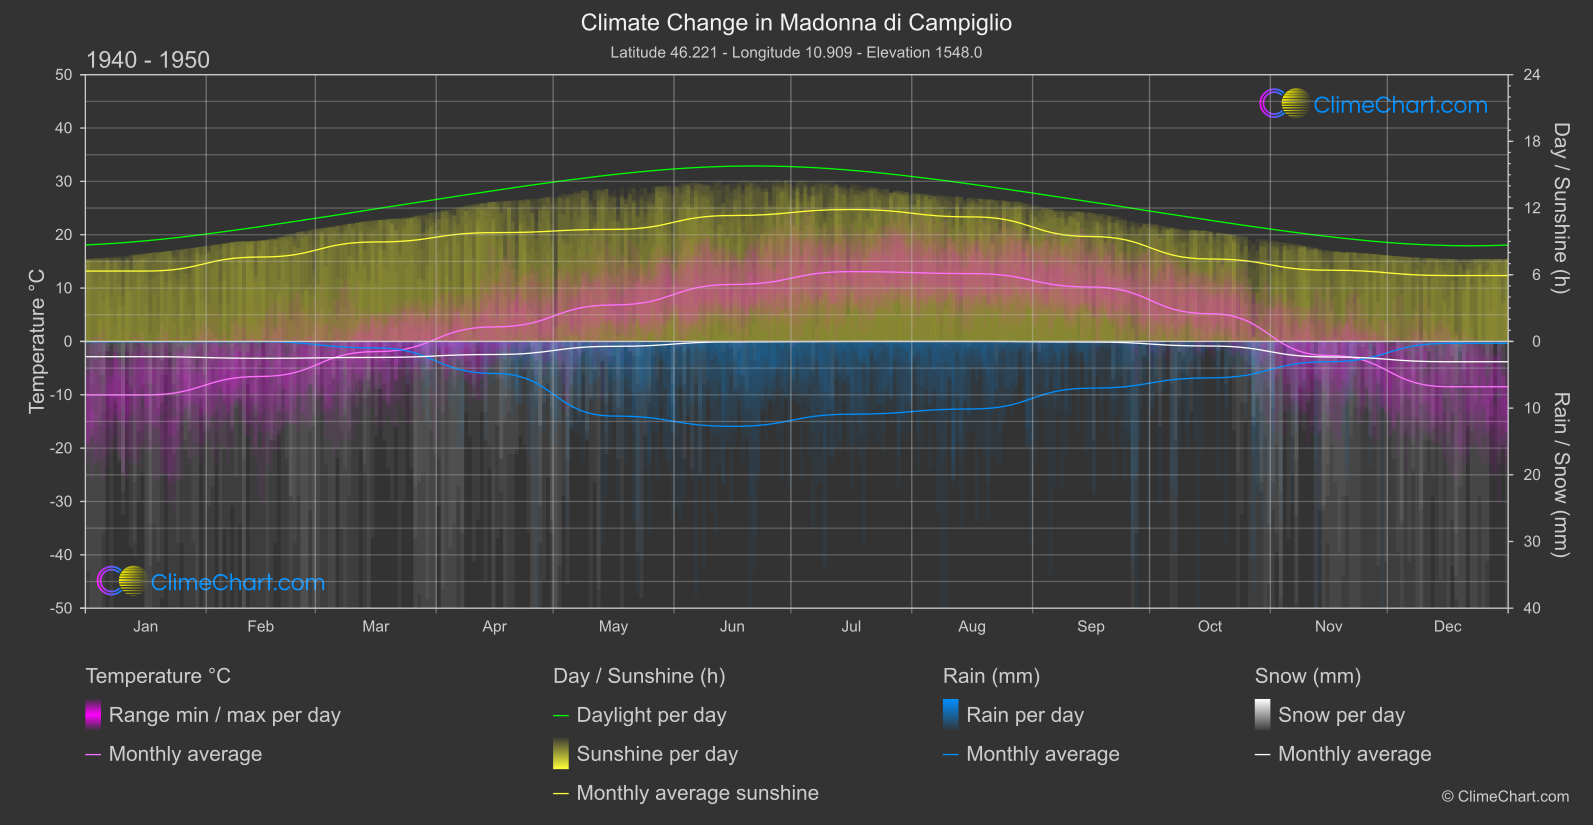
Madonna di Campiglio, a picturesque town in Italy, has experienced notable changes in its climate over the years. The data reveals interesting trends, such as a significant increase in temperatures during the summer months of June, July, and August. Additionally, the analysis shows varying patterns in rainfall, with October exhibiting the highest change in precipitation levels. Snowfall has also shown fluctuations, notably with November experiencing a substantial increase in snowfall. Sunshine duration has seen mixed results, with June showcasing a significant rise in sun hours while November and December witnessing a decrease. These insights provide a comprehensive overview of the climate shifts in Madonna di Campiglio, aiding in understanding the environmental changes impacting the region.
Climate Change Data Overview for Madonna di Campiglio, Italy
Explore the comprehensive climate change data for Madonna di Campiglio, Italy. This detailed table provides valuable insights into temperature variations, precipitation levels, and seasonal changes influenced by climate change, helping you understand the unique weather patterns of this region.
Temperature °C
| Month | ⌀ 1940 - 1950 | ⌀ 2013 - 2023 | +/- |
|---|---|---|---|
| Jan | -10.03 | -4.71 | 5.32 |
| Feb | -6.56 | -3.00 | 3.56 |
| Mar | -1.91 | -0.14 | 1.78 |
| Apr | 2.73 | 3.59 | 0.86 |
| May | 6.84 | 7.74 | 0.90 |
| Jun | 10.68 | 12.92 | 2.24 |
| Jul | 13.09 | 14.82 | 1.74 |
| Aug | 12.72 | 14.30 | 1.58 |
| Sep | 10.20 | 10.61 | 0.40 |
| Oct | 5.20 | 6.49 | 1.29 |
| Nov | -2.64 | 0.86 | 3.50 |
| Dec | -8.49 | -2.45 | 6.04 |
| ⌀ Month | 2.65 | 5.09 | 2.43 |
Sunshine (h)
| Month | ⌀ 1940 - 1950 | ⌀ 2013 - 2023 | +/- |
|---|---|---|---|
| Jan | 6.33 | 6.43 | 0.10 |
| Feb | 7.60 | 7.12 | -0.48 |
| Mar | 8.95 | 8.66 | -0.29 |
| Apr | 9.79 | 9.60 | -0.19 |
| May | 10.08 | 9.92 | -0.16 |
| Jun | 11.33 | 12.29 | 0.96 |
| Jul | 11.87 | 12.08 | 0.21 |
| Aug | 11.20 | 10.99 | -0.22 |
| Sep | 9.44 | 9.52 | 0.08 |
| Oct | 7.42 | 7.40 | -0.01 |
| Nov | 6.41 | 5.61 | -0.80 |
| Dec | 5.93 | 5.80 | -0.13 |
| ⌀ Month | 8.86 | 8.78 | -0.08 |
Rain (mm)
| Month | ⌀ 1940 - 1950 | ⌀ 2013 - 2023 | +/- |
|---|---|---|---|
| Jan | 0.02 | 0.12 | 0.10 |
| Feb | 0.02 | 0.16 | 0.14 |
| Mar | 0.48 | 0.41 | -0.07 |
| Apr | 2.40 | 2.84 | 0.44 |
| May | 5.59 | 5.76 | 0.16 |
| Jun | 6.37 | 5.52 | -0.85 |
| Jul | 5.46 | 5.63 | 0.18 |
| Aug | 5.06 | 5.44 | 0.38 |
| Sep | 3.50 | 4.08 | 0.58 |
| Oct | 2.73 | 4.56 | 1.82 |
| Nov | 1.52 | 2.56 | 1.04 |
| Dec | 0.14 | 0.46 | 0.31 |
| ⌀ Month | 2.78 | 3.13 | 0.35 |
Snow (mm)
| Month | ⌀ 1940 - 1950 | ⌀ 2013 - 2023 | +/- |
|---|---|---|---|
| Jan | 1.14 | 1.55 | 0.41 |
| Feb | 1.26 | 2.07 | 0.80 |
| Mar | 1.20 | 1.45 | 0.25 |
| Apr | 0.98 | 1.17 | 0.19 |
| May | 0.37 | 0.29 | -0.08 |
| Jun | 0.03 | 0.01 | -0.03 |
| Jul | 0.00 | 0.00 | -0.00 |
| Aug | 0.00 | 0.00 | 0.00 |
| Sep | 0.04 | 0.03 | -0.01 |
| Oct | 0.34 | 0.26 | -0.08 |
| Nov | 1.16 | 1.89 | 0.73 |
| Dec | 1.52 | 1.80 | 0.27 |
| ⌀ Month | 0.67 | 0.88 | 0.20 |