Climate Change Chart of Los Angeles, USA
Comprehensive Climate Change Chart of Los Angeles, USA: Monthly Averages and Impact Trends
Exploring the changing climate in Los Angeles, United States of America reveals intriguing insights.
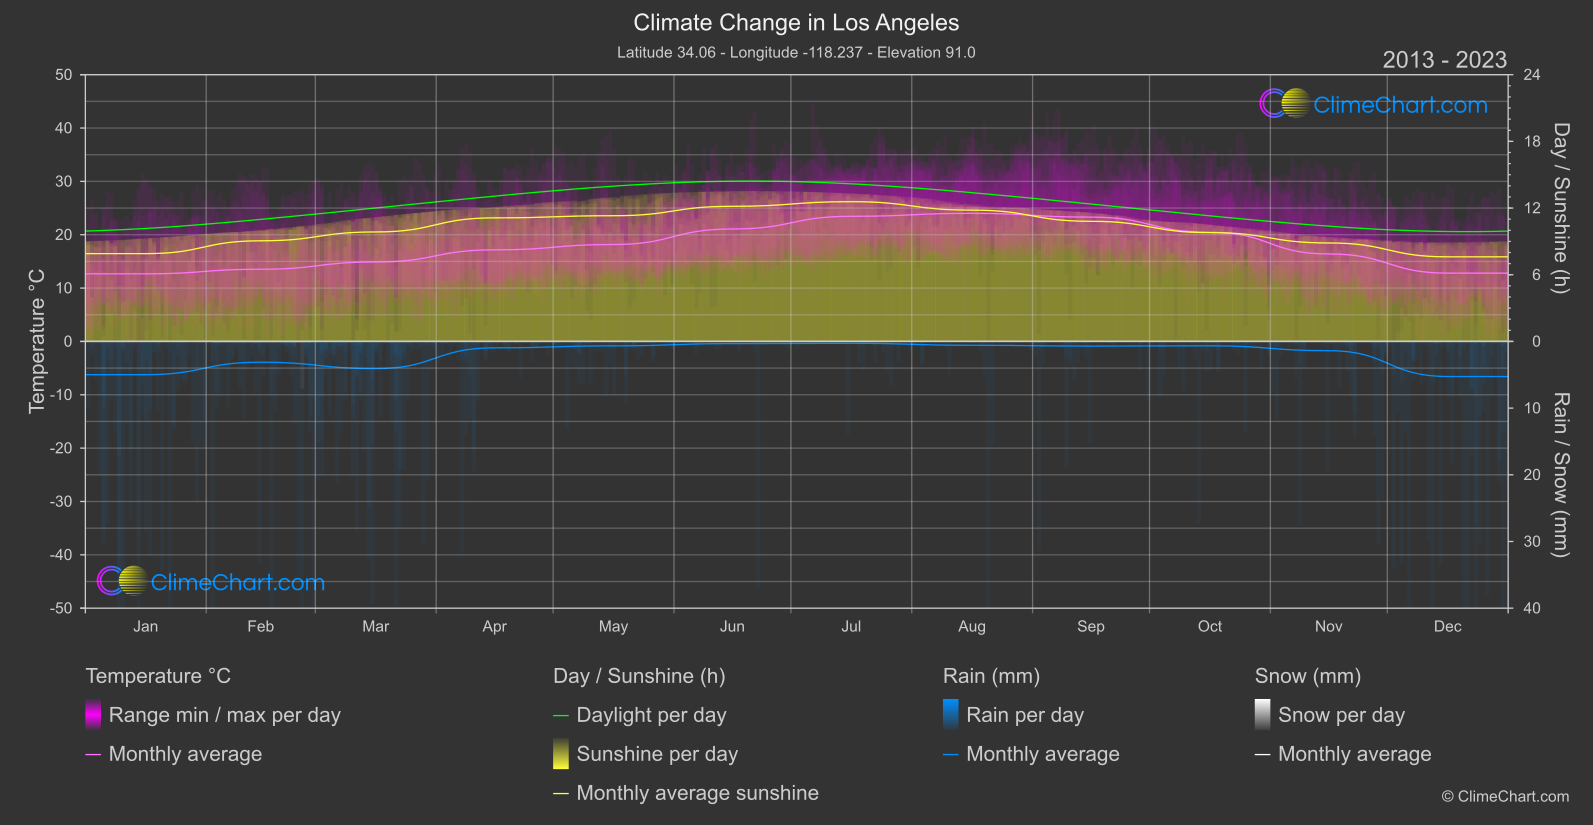
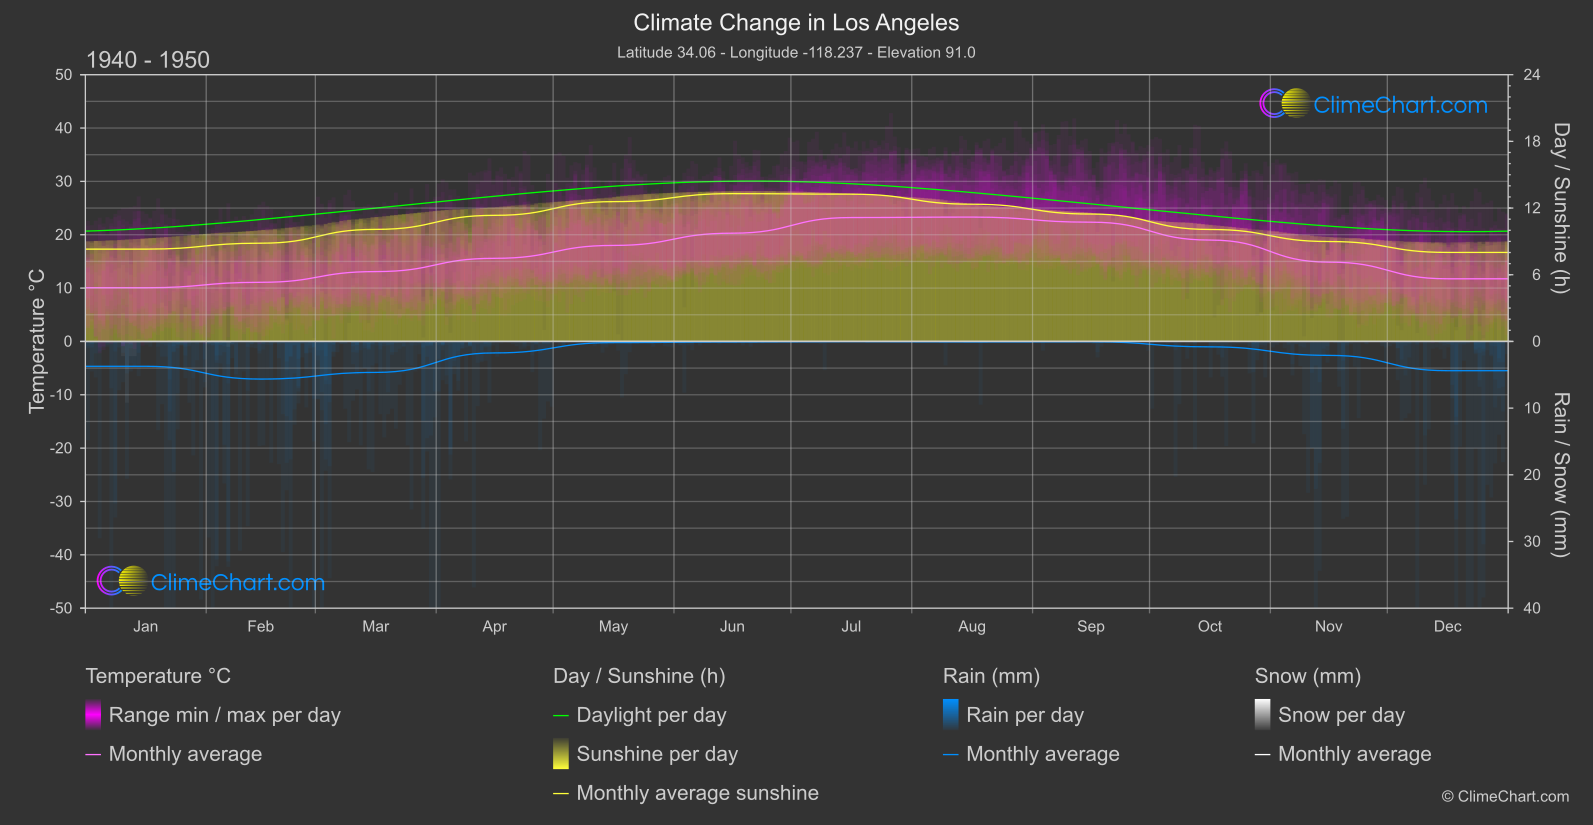
Los Angeles, known for its sunny weather, has experienced notable climate changes over the years. Analyzing the data, we find that the month with the highest temperature change is June, with a significant increase of 0.79°C. In terms of rainfall, February shows the most drastic change with a decrease of 1.26mm. Snowfall remains negligible in Los Angeles. Moreover, the sunshine duration has decreased across all months, with May experiencing the largest drop of 1.27 hours.
Climate Change Data Overview for Los Angeles, USA
Explore the comprehensive climate change data for Los Angeles, USA. This detailed table provides valuable insights into temperature variations, precipitation levels, and seasonal changes influenced by climate change, helping you understand the unique weather patterns of this region.
Temperature °C
| Month | ⌀ 1940 - 1950 | ⌀ 2013 - 2023 | +/- |
|---|---|---|---|
| Jan | 10.06 | 12.67 | 2.61 |
| Feb | 11.08 | 13.53 | 2.45 |
| Mar | 13.09 | 14.89 | 1.80 |
| Apr | 15.58 | 17.17 | 1.59 |
| May | 18.00 | 18.17 | 0.17 |
| Jun | 20.29 | 21.08 | 0.79 |
| Jul | 23.22 | 23.46 | 0.23 |
| Aug | 23.31 | 24.01 | 0.70 |
| Sep | 22.35 | 23.30 | 0.95 |
| Oct | 19.00 | 20.46 | 1.46 |
| Nov | 14.87 | 16.39 | 1.53 |
| Dec | 11.74 | 12.80 | 1.06 |
| ⌀ Month | 16.88 | 18.16 | 1.28 |
Sunshine (h)
| Month | ⌀ 1940 - 1950 | ⌀ 2013 - 2023 | +/- |
|---|---|---|---|
| Jan | 8.30 | 7.90 | -0.40 |
| Feb | 8.84 | 9.05 | 0.22 |
| Mar | 10.08 | 9.85 | -0.23 |
| Apr | 11.34 | 11.12 | -0.23 |
| May | 12.58 | 11.31 | -1.27 |
| Jun | 13.30 | 12.16 | -1.14 |
| Jul | 13.25 | 12.57 | -0.68 |
| Aug | 12.35 | 11.81 | -0.53 |
| Sep | 11.46 | 10.81 | -0.65 |
| Oct | 10.07 | 9.79 | -0.28 |
| Nov | 8.99 | 8.86 | -0.13 |
| Dec | 8.01 | 7.61 | -0.40 |
| ⌀ Month | 10.71 | 10.24 | -0.48 |
Rain (mm)
| Month | ⌀ 1940 - 1950 | ⌀ 2013 - 2023 | +/- |
|---|---|---|---|
| Jan | 1.86 | 2.49 | 0.63 |
| Feb | 2.82 | 1.56 | -1.26 |
| Mar | 2.32 | 2.04 | -0.29 |
| Apr | 0.86 | 0.48 | -0.38 |
| May | 0.09 | 0.33 | 0.25 |
| Jun | 0.04 | 0.16 | 0.12 |
| Jul | 0.01 | 0.14 | 0.13 |
| Aug | 0.04 | 0.29 | 0.25 |
| Sep | 0.02 | 0.35 | 0.32 |
| Oct | 0.41 | 0.33 | -0.08 |
| Nov | 1.05 | 0.69 | -0.35 |
| Dec | 2.19 | 2.63 | 0.44 |
| ⌀ Month | 0.98 | 0.96 | -0.02 |
Snow (mm)
| Month | ⌀ 1940 - 1950 | ⌀ 2013 - 2023 | +/- |
|---|---|---|---|
| Jan | 0.00 | 0.00 | -0.00 |
| Feb | 0.00 | 0.00 | 0.00 |
| Mar | 0.00 | 0.00 | 0.00 |
| Apr | 0.00 | 0.00 | 0.00 |
| May | 0.00 | 0.00 | 0.00 |
| Jun | 0.00 | 0.00 | 0.00 |
| Jul | 0.00 | 0.00 | 0.00 |
| Aug | 0.00 | 0.00 | 0.00 |
| Sep | 0.00 | 0.00 | 0.00 |
| Oct | 0.00 | 0.00 | 0.00 |
| Nov | 0.00 | 0.00 | 0.00 |
| Dec | 0.00 | 0.00 | 0.00 |
| ⌀ Month | 0.00 | 0.00 | -0.00 |