Climate Change Chart of Ljubljana, Slovenia
Comprehensive Climate Change Chart of Ljubljana, Slovenia: Monthly Averages and Impact Trends
Explore the changing climate in Ljubljana, Slovenia with insightful data analysis. Discover the significant shifts in temperature, rainfall, snowfall, and sunshine duration over the years.
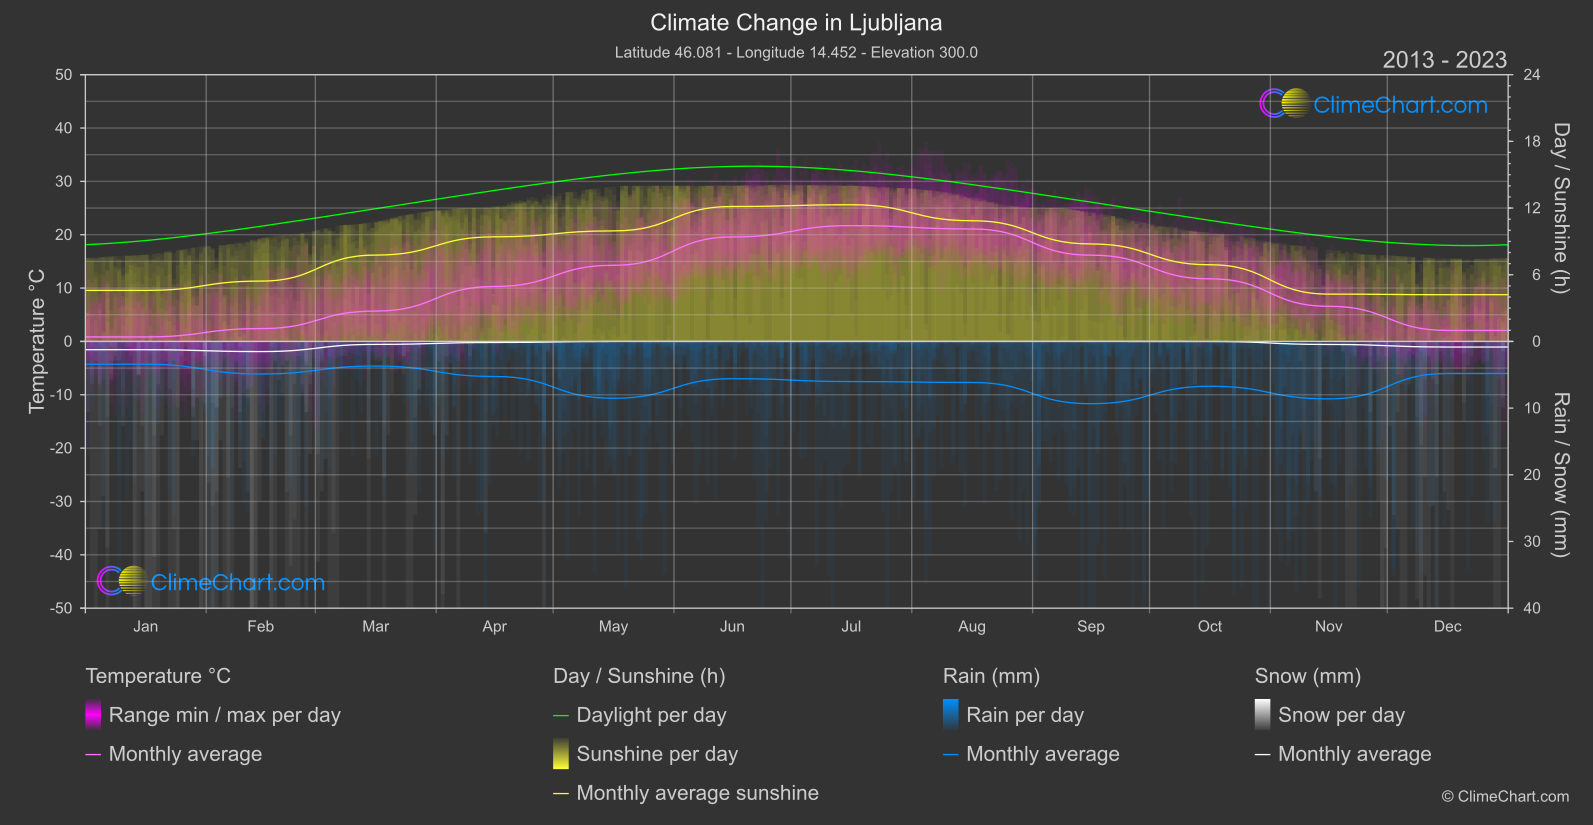
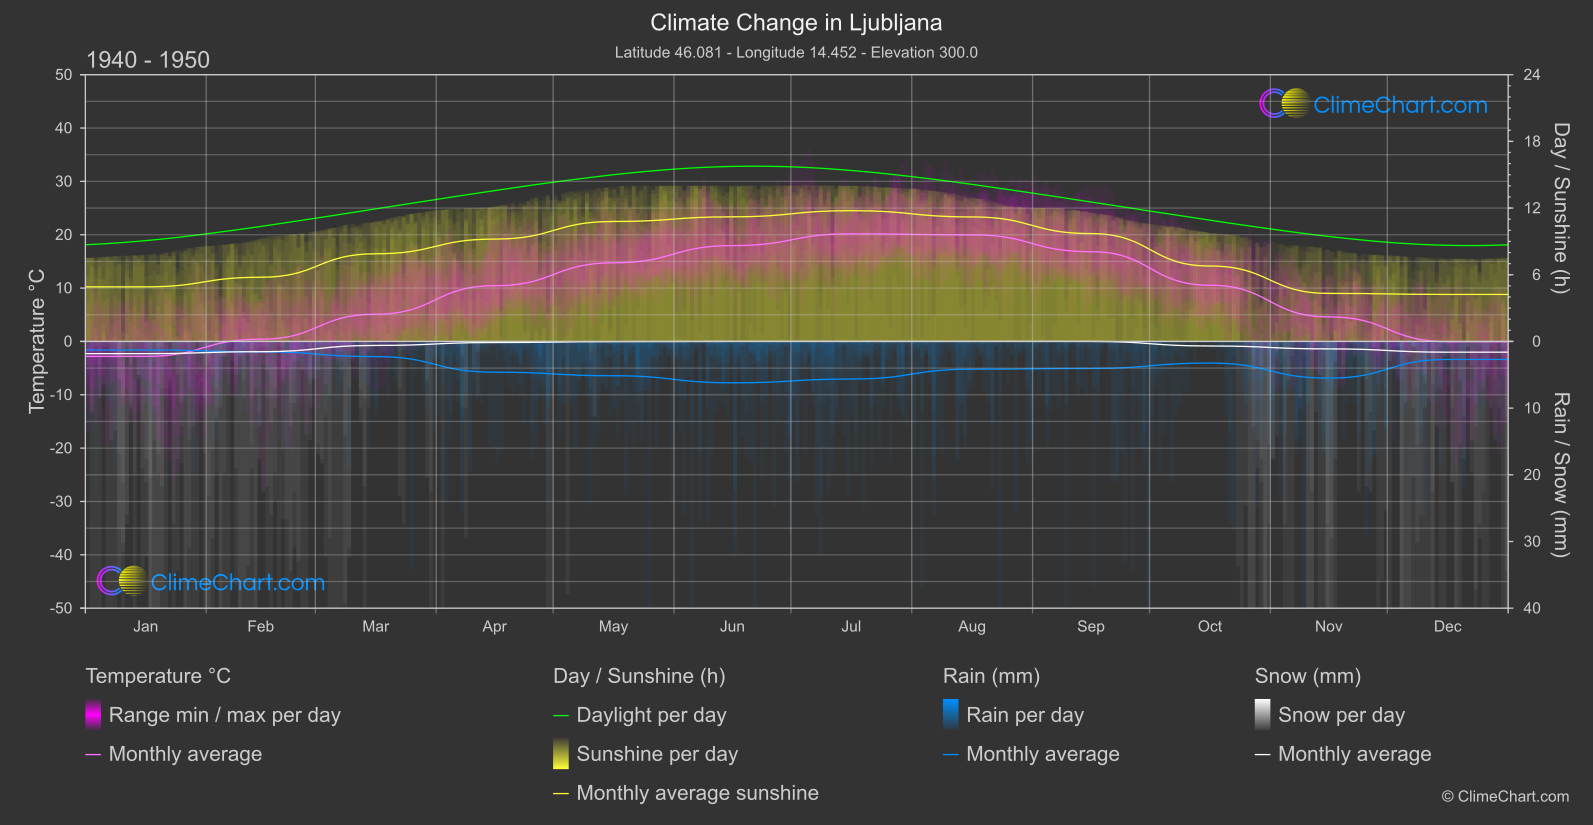
Ljubljana, the capital of Slovenia, has experienced notable changes in its climate over the years. From the data analysis, it is evident that June has shown the highest increase in temperature, while September has witnessed a significant decrease. Additionally, September has seen the most substantial rise in rainfall compared to other months. The snowfall has decreased in general, with December showing the most prominent decline. Sunshine duration has fluctuated, with June and July having the highest increment in recent years.
Climate Change Data Overview for Ljubljana, Slovenia
Explore the comprehensive climate change data for Ljubljana, Slovenia. This detailed table provides valuable insights into temperature variations, precipitation levels, and seasonal changes influenced by climate change, helping you understand the unique weather patterns of this region.
Temperature °C
| Month | ⌀ 1940 - 1950 | ⌀ 2013 - 2023 | +/- |
|---|---|---|---|
| Jan | -2.80 | 0.85 | 3.65 |
| Feb | 0.42 | 2.41 | 1.99 |
| Mar | 5.11 | 5.69 | 0.58 |
| Apr | 10.44 | 10.30 | -0.14 |
| May | 14.74 | 14.28 | -0.46 |
| Jun | 17.96 | 19.58 | 1.62 |
| Jul | 20.17 | 21.71 | 1.54 |
| Aug | 19.98 | 21.08 | 1.10 |
| Sep | 16.82 | 16.18 | -0.64 |
| Oct | 10.53 | 11.73 | 1.20 |
| Nov | 4.60 | 6.59 | 1.98 |
| Dec | -0.05 | 2.06 | 2.11 |
| ⌀ Month | 9.83 | 11.04 | 1.21 |
Sunshine (h)
| Month | ⌀ 1940 - 1950 | ⌀ 2013 - 2023 | +/- |
|---|---|---|---|
| Jan | 4.91 | 4.59 | -0.32 |
| Feb | 5.77 | 5.43 | -0.35 |
| Mar | 7.89 | 7.77 | -0.12 |
| Apr | 9.21 | 9.41 | 0.20 |
| May | 10.79 | 9.95 | -0.85 |
| Jun | 11.21 | 12.14 | 0.93 |
| Jul | 11.76 | 12.30 | 0.53 |
| Aug | 11.20 | 10.86 | -0.34 |
| Sep | 9.70 | 8.77 | -0.93 |
| Oct | 6.78 | 6.90 | 0.11 |
| Nov | 4.32 | 4.26 | -0.07 |
| Dec | 4.23 | 4.20 | -0.03 |
| ⌀ Month | 8.15 | 8.05 | -0.10 |
Rain (mm)
| Month | ⌀ 1940 - 1950 | ⌀ 2013 - 2023 | +/- |
|---|---|---|---|
| Jan | 0.64 | 1.71 | 1.07 |
| Feb | 0.77 | 2.44 | 1.67 |
| Mar | 1.14 | 1.85 | 0.71 |
| Apr | 2.31 | 2.63 | 0.32 |
| May | 2.57 | 4.26 | 1.69 |
| Jun | 3.10 | 2.79 | -0.31 |
| Jul | 2.82 | 3.01 | 0.19 |
| Aug | 2.08 | 3.08 | 1.00 |
| Sep | 2.03 | 4.67 | 2.65 |
| Oct | 1.62 | 3.36 | 1.74 |
| Nov | 2.75 | 4.31 | 1.56 |
| Dec | 1.35 | 2.40 | 1.05 |
| ⌀ Month | 1.93 | 3.04 | 1.11 |
Snow (mm)
| Month | ⌀ 1940 - 1950 | ⌀ 2013 - 2023 | +/- |
|---|---|---|---|
| Jan | 0.92 | 0.62 | -0.30 |
| Feb | 0.77 | 0.76 | -0.01 |
| Mar | 0.30 | 0.22 | -0.08 |
| Apr | 0.08 | 0.08 | -0.00 |
| May | 0.02 | 0.00 | -0.02 |
| Jun | 0.00 | 0.00 | 0.00 |
| Jul | 0.00 | 0.00 | 0.00 |
| Aug | 0.00 | 0.00 | 0.00 |
| Sep | 0.00 | 0.00 | 0.00 |
| Oct | 0.34 | 0.00 | -0.34 |
| Nov | 0.56 | 0.23 | -0.33 |
| Dec | 0.81 | 0.42 | -0.39 |
| ⌀ Month | 0.32 | 0.19 | -0.12 |