Climate Change Chart of Lincoln, USA
Comprehensive Climate Change Chart of Lincoln, USA: Monthly Averages and Impact Trends
Explore the changing climate in Lincoln, USA with insights from temperature, rainfall, snowfall, and sunshine duration data.
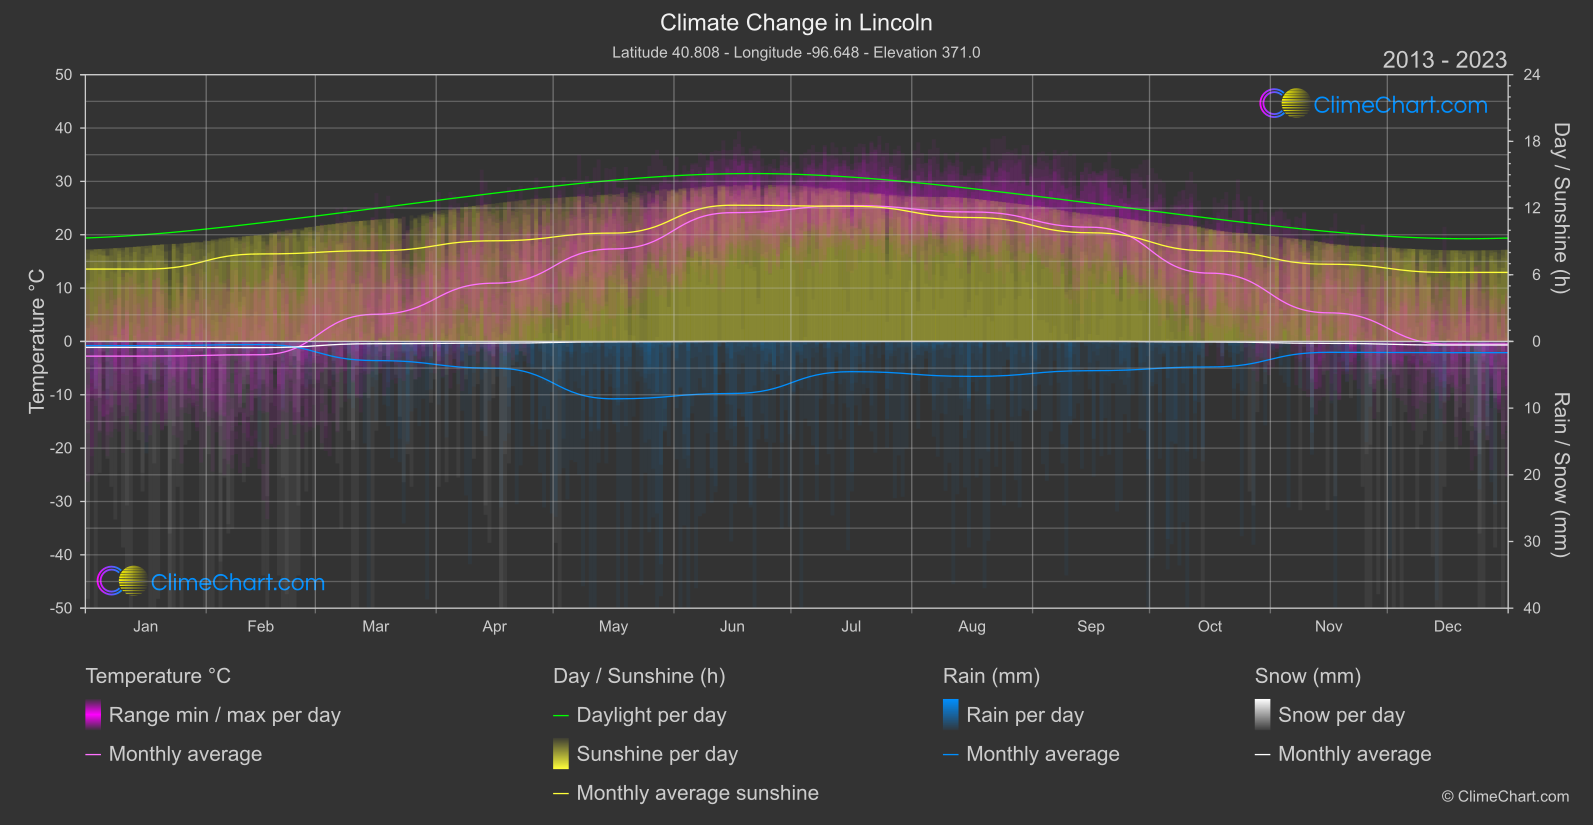
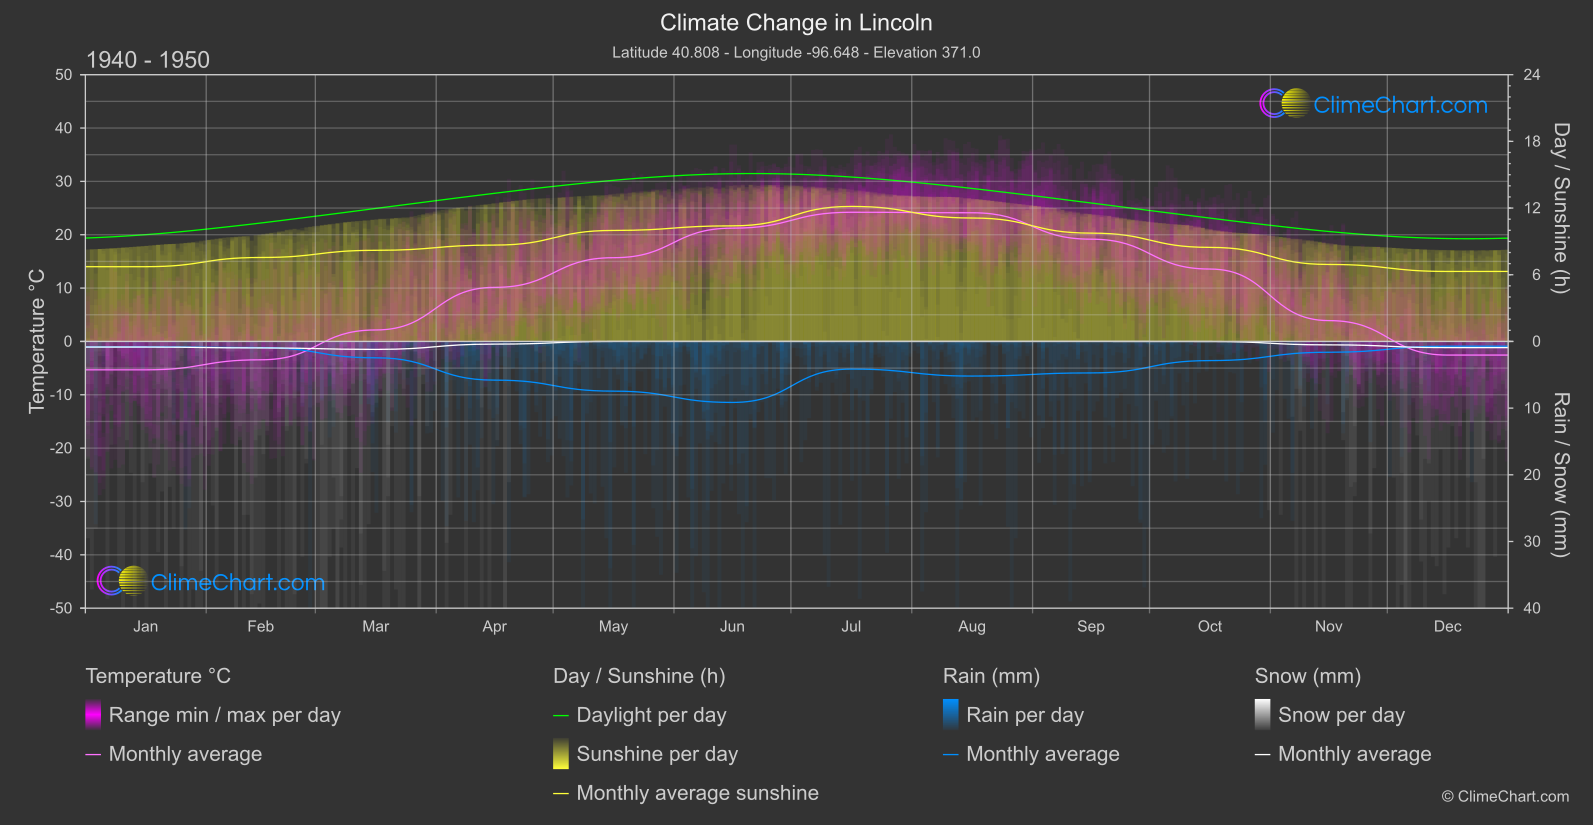
Lincoln, USA experiences notable changes in temperature, rainfall, snowfall, and sunshine duration over the years. From January to December, various months exhibit different patterns of change. For instance, June shows a significant rise in temperature compared to the 1940s, while October experiences a decrease. In terms of rainfall, May sees an increase, whereas September witnesses a decrease. Snowfall remains relatively stable throughout the months. Sunshine duration fluctuates, with June having a substantial increase in sunshine hours.
Climate Change Data Overview for Lincoln, USA
Explore the comprehensive climate change data for Lincoln, USA. This detailed table provides valuable insights into temperature variations, precipitation levels, and seasonal changes influenced by climate change, helping you understand the unique weather patterns of this region.
Temperature °C
| Month | ⌀ 1940 - 1950 | ⌀ 2013 - 2023 | +/- |
|---|---|---|---|
| Jan | -5.32 | -2.76 | 2.57 |
| Feb | -3.44 | -2.49 | 0.95 |
| Mar | 2.15 | 5.08 | 2.94 |
| Apr | 10.13 | 10.92 | 0.79 |
| May | 15.70 | 17.33 | 1.63 |
| Jun | 21.23 | 24.14 | 2.91 |
| Jul | 24.21 | 25.47 | 1.25 |
| Aug | 24.12 | 24.27 | 0.15 |
| Sep | 19.16 | 21.41 | 2.24 |
| Oct | 13.57 | 12.80 | -0.77 |
| Nov | 3.91 | 5.36 | 1.45 |
| Dec | -2.56 | -0.50 | 2.05 |
| ⌀ Month | 10.24 | 11.75 | 1.51 |
Sunshine (h)
| Month | ⌀ 1940 - 1950 | ⌀ 2013 - 2023 | +/- |
|---|---|---|---|
| Jan | 6.73 | 6.51 | -0.21 |
| Feb | 7.55 | 7.87 | 0.32 |
| Mar | 8.20 | 8.17 | -0.03 |
| Apr | 8.67 | 9.06 | 0.39 |
| May | 9.99 | 9.75 | -0.24 |
| Jun | 10.40 | 12.26 | 1.86 |
| Jul | 12.15 | 12.16 | 0.01 |
| Aug | 11.10 | 11.15 | 0.04 |
| Sep | 9.75 | 9.78 | 0.03 |
| Oct | 8.46 | 8.15 | -0.31 |
| Nov | 6.93 | 6.95 | 0.02 |
| Dec | 6.30 | 6.21 | -0.09 |
| ⌀ Month | 8.85 | 9.00 | 0.15 |
Rain (mm)
| Month | ⌀ 1940 - 1950 | ⌀ 2013 - 2023 | +/- |
|---|---|---|---|
| Jan | 0.41 | 0.32 | -0.09 |
| Feb | 0.46 | 0.24 | -0.22 |
| Mar | 1.23 | 1.44 | 0.21 |
| Apr | 2.90 | 2.01 | -0.89 |
| May | 3.73 | 4.30 | 0.58 |
| Jun | 4.57 | 3.90 | -0.67 |
| Jul | 2.07 | 2.27 | 0.19 |
| Aug | 2.60 | 2.62 | 0.02 |
| Sep | 2.36 | 2.19 | -0.17 |
| Oct | 1.44 | 1.91 | 0.48 |
| Nov | 0.81 | 0.82 | 0.00 |
| Dec | 0.36 | 0.84 | 0.48 |
| ⌀ Month | 1.91 | 1.90 | -0.01 |
Snow (mm)
| Month | ⌀ 1940 - 1950 | ⌀ 2013 - 2023 | +/- |
|---|---|---|---|
| Jan | 0.42 | 0.45 | 0.02 |
| Feb | 0.49 | 0.46 | -0.02 |
| Mar | 0.60 | 0.17 | -0.43 |
| Apr | 0.20 | 0.13 | -0.07 |
| May | 0.00 | 0.03 | 0.03 |
| Jun | 0.00 | 0.00 | 0.00 |
| Jul | 0.00 | 0.00 | 0.00 |
| Aug | 0.00 | 0.00 | 0.00 |
| Sep | 0.00 | 0.00 | 0.00 |
| Oct | 0.01 | 0.04 | 0.03 |
| Nov | 0.26 | 0.15 | -0.11 |
| Dec | 0.46 | 0.27 | -0.19 |
| ⌀ Month | 0.20 | 0.14 | -0.06 |