Climate Change Chart of Leipzig, Germany
Comprehensive Climate Change Chart of Leipzig, Germany: Monthly Averages and Impact Trends
Exploring the changing climate in Leipzig, Germany reveals intriguing insights into temperature, rainfall, snowfall, and sunshine duration over the years.
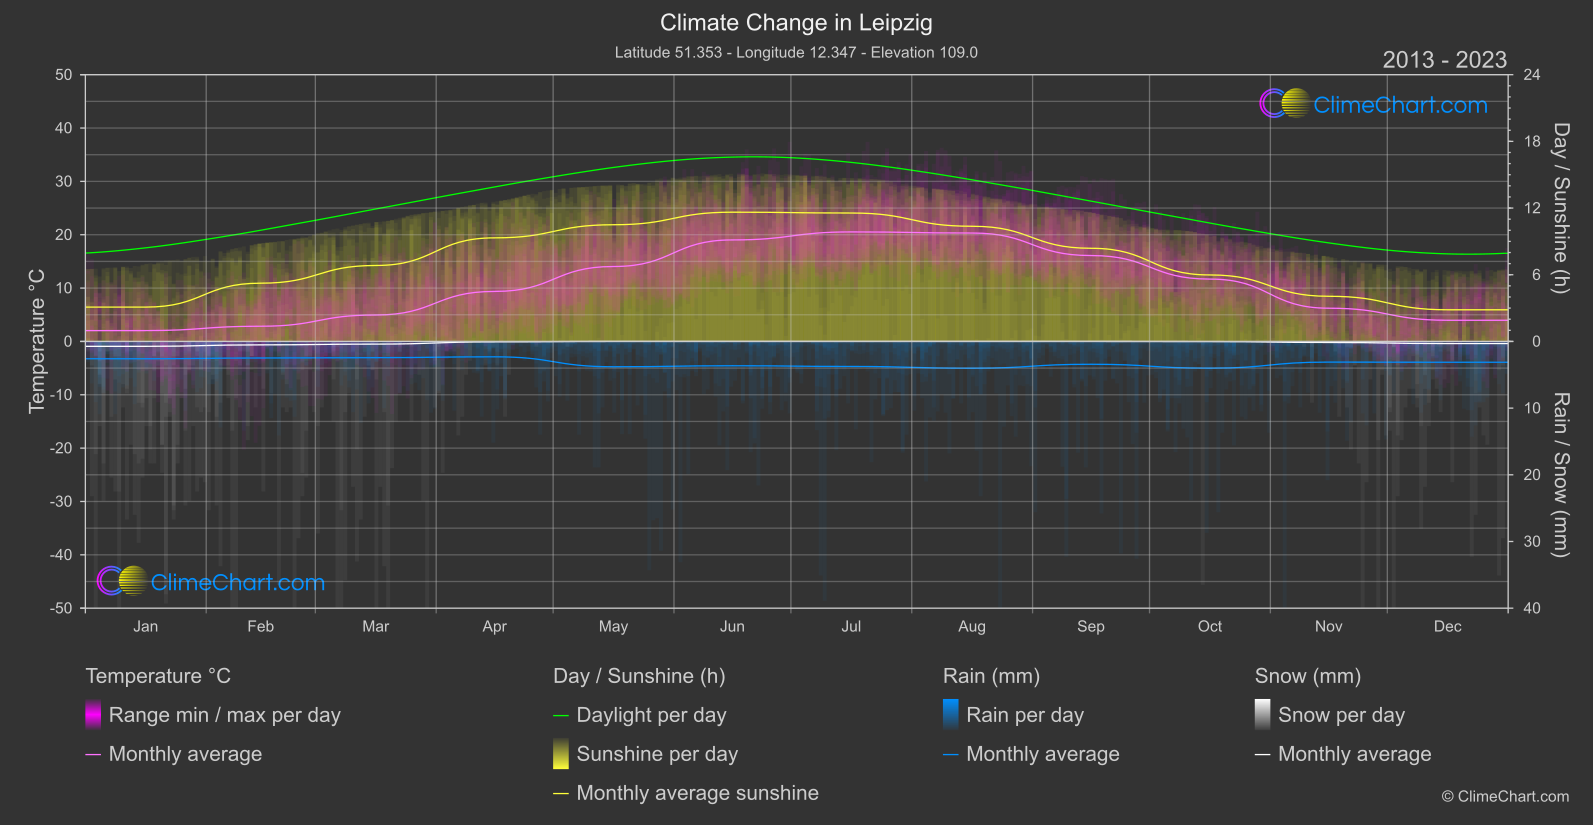
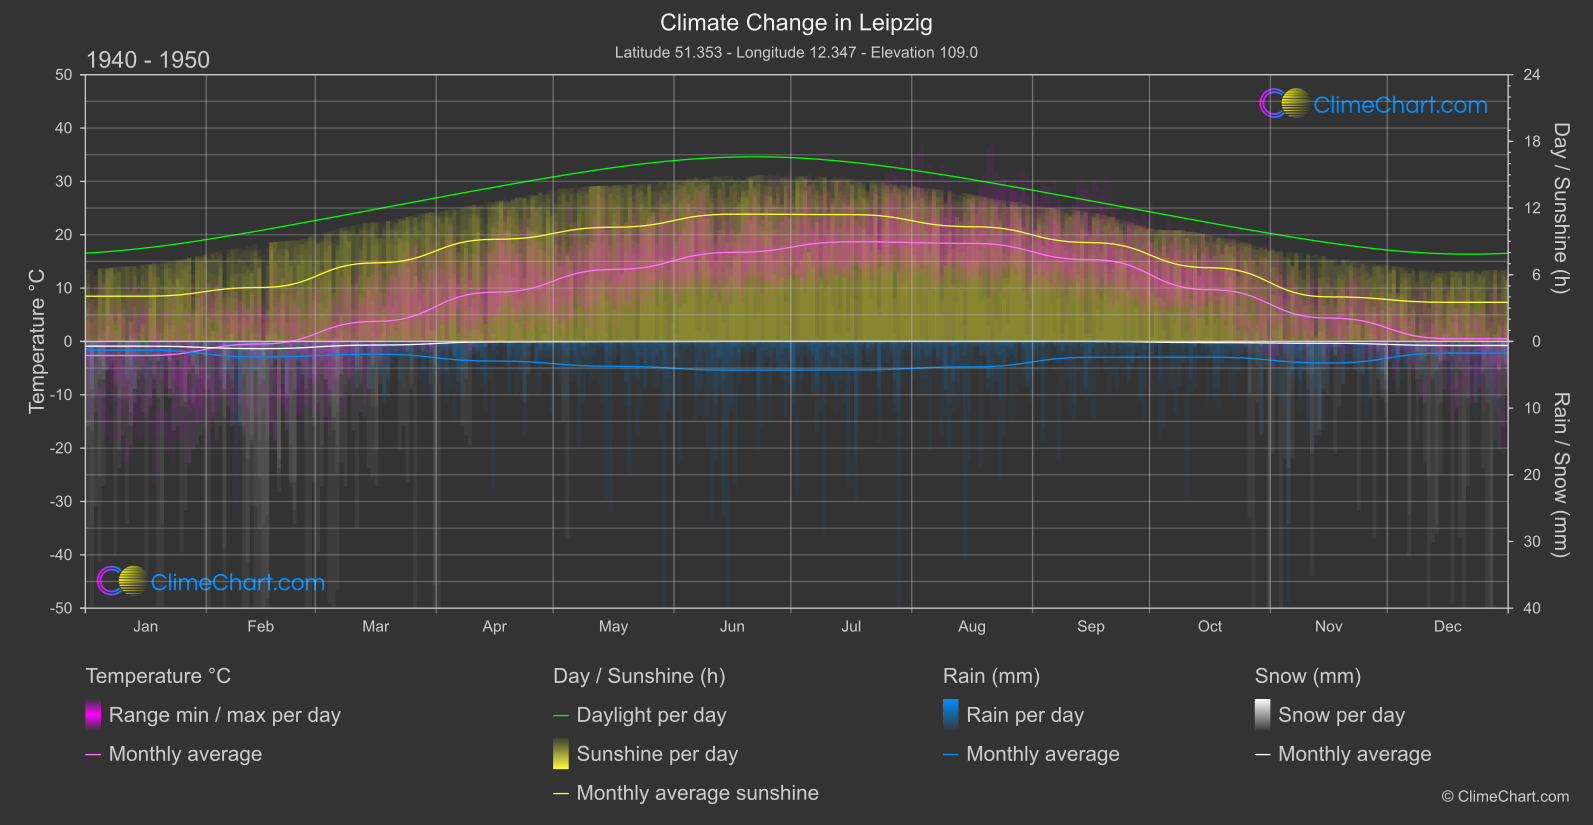
Leipzig, Germany, has experienced notable changes in climate parameters. The data shows varying trends in temperature, rainfall, snowfall, and sunshine duration across different months. For instance, June exhibits a significant increase in temperature compared to previous years, while August shows a noticeable rise in sunshine duration. Understanding these patterns can help in assessing the impact of climate change on Leipzig's environment.
Climate Change Data Overview for Leipzig, Germany
Explore the comprehensive climate change data for Leipzig, Germany. This detailed table provides valuable insights into temperature variations, precipitation levels, and seasonal changes influenced by climate change, helping you understand the unique weather patterns of this region.
Temperature °C
| Month | ⌀ 1940 - 1950 | ⌀ 2013 - 2023 | +/- |
|---|---|---|---|
| Jan | -2.64 | 2.03 | 4.67 |
| Feb | -0.48 | 2.85 | 3.33 |
| Mar | 3.75 | 4.96 | 1.20 |
| Apr | 9.23 | 9.37 | 0.14 |
| May | 13.50 | 14.04 | 0.54 |
| Jun | 16.69 | 19.03 | 2.33 |
| Jul | 18.68 | 20.53 | 1.85 |
| Aug | 18.37 | 20.32 | 1.95 |
| Sep | 15.32 | 16.10 | 0.78 |
| Oct | 9.69 | 11.69 | 1.99 |
| Nov | 4.39 | 6.23 | 1.84 |
| Dec | 0.53 | 3.97 | 3.44 |
| ⌀ Month | 8.92 | 10.93 | 2.01 |
Sunshine (h)
| Month | ⌀ 1940 - 1950 | ⌀ 2013 - 2023 | +/- |
|---|---|---|---|
| Jan | 4.07 | 3.09 | -0.98 |
| Feb | 4.85 | 5.24 | 0.39 |
| Mar | 7.07 | 6.83 | -0.23 |
| Apr | 9.19 | 9.32 | 0.13 |
| May | 10.27 | 10.50 | 0.23 |
| Jun | 11.45 | 11.63 | 0.18 |
| Jul | 11.41 | 11.55 | 0.14 |
| Aug | 10.32 | 10.36 | 0.04 |
| Sep | 8.89 | 8.38 | -0.51 |
| Oct | 6.63 | 5.98 | -0.65 |
| Nov | 4.01 | 4.06 | 0.05 |
| Dec | 3.52 | 2.85 | -0.67 |
| ⌀ Month | 7.64 | 7.48 | -0.16 |
Rain (mm)
| Month | ⌀ 1940 - 1950 | ⌀ 2013 - 2023 | +/- |
|---|---|---|---|
| Jan | 0.65 | 1.30 | 0.65 |
| Feb | 1.16 | 1.24 | 0.08 |
| Mar | 0.96 | 1.22 | 0.26 |
| Apr | 1.47 | 1.15 | -0.32 |
| May | 1.86 | 1.90 | 0.03 |
| Jun | 2.16 | 1.82 | -0.33 |
| Jul | 2.14 | 1.88 | -0.26 |
| Aug | 1.90 | 2.01 | 0.10 |
| Sep | 1.19 | 1.71 | 0.52 |
| Oct | 1.18 | 2.00 | 0.82 |
| Nov | 1.61 | 1.55 | -0.07 |
| Dec | 0.87 | 1.56 | 0.69 |
| ⌀ Month | 1.43 | 1.61 | 0.18 |
Snow (mm)
| Month | ⌀ 1940 - 1950 | ⌀ 2013 - 2023 | +/- |
|---|---|---|---|
| Jan | 0.36 | 0.37 | 0.01 |
| Feb | 0.54 | 0.26 | -0.28 |
| Mar | 0.27 | 0.20 | -0.07 |
| Apr | 0.04 | 0.03 | -0.01 |
| May | 0.01 | 0.00 | -0.01 |
| Jun | 0.00 | 0.00 | 0.00 |
| Jul | 0.00 | 0.00 | 0.00 |
| Aug | 0.00 | 0.00 | 0.00 |
| Sep | 0.00 | 0.00 | 0.00 |
| Oct | 0.09 | 0.01 | -0.08 |
| Nov | 0.14 | 0.08 | -0.06 |
| Dec | 0.30 | 0.16 | -0.14 |
| ⌀ Month | 0.15 | 0.09 | -0.05 |