Climate Change Chart of Las Vegas, USA
Comprehensive Climate Change Chart of Las Vegas, USA: Monthly Averages and Impact Trends
Exploring the climate change data in Las Vegas, United States of America reveals intriguing trends over the years.
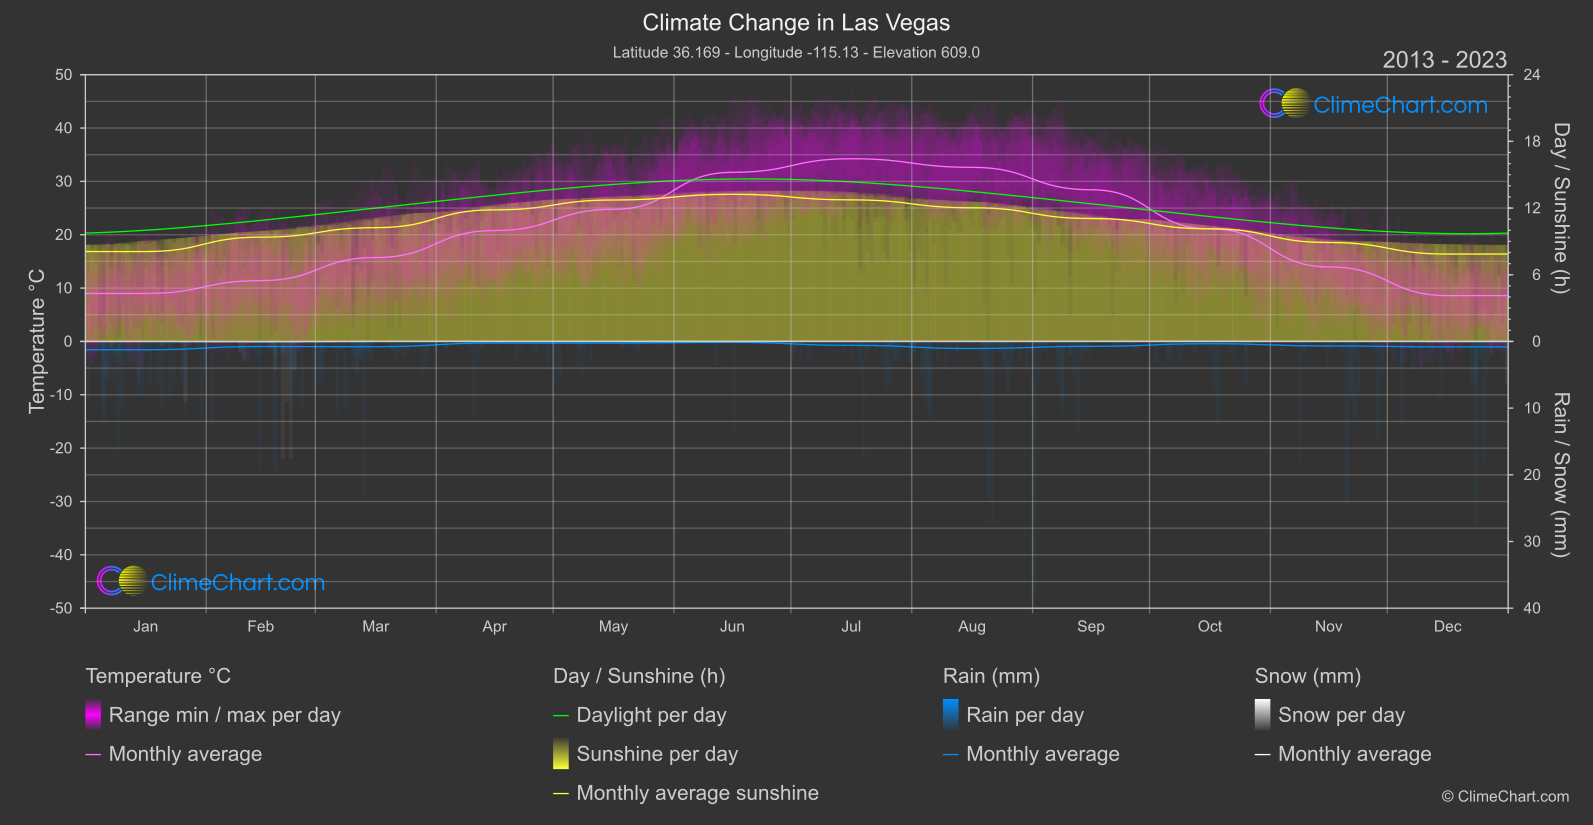
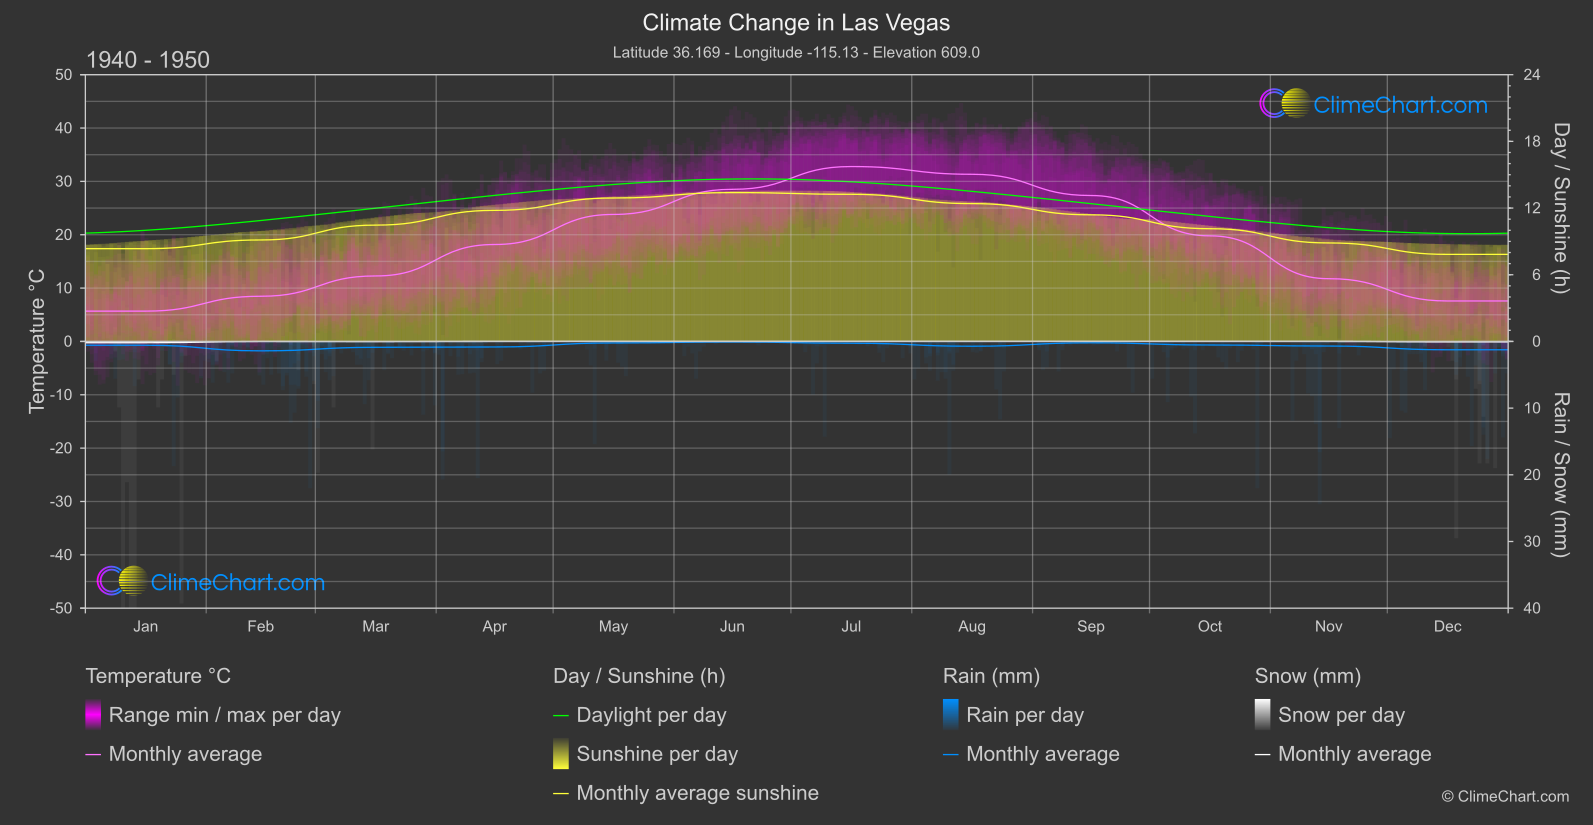
Las Vegas, known for its desert climate, has experienced notable changes in temperature, rainfall, snowfall, and sunshine duration over the years. Analyzing the data from 1940 to 1950 compared to 2013 to 2024, it is evident that certain months have shown significant variations. For example, June recorded a temperature increase of 3.19°C, while September saw a rainfall increase of 0.26 mm. These shifts in climate indicators provide valuable insights into the evolving weather patterns in Las Vegas.
Climate Change Data Overview for Las Vegas, USA
Explore the comprehensive climate change data for Las Vegas, USA. This detailed table provides valuable insights into temperature variations, precipitation levels, and seasonal changes influenced by climate change, helping you understand the unique weather patterns of this region.
Temperature °C
| Month | ⌀ 1940 - 1950 | ⌀ 2013 - 2023 | +/- |
|---|---|---|---|
| Jan | 5.68 | 8.99 | 3.31 |
| Feb | 8.47 | 11.40 | 2.93 |
| Mar | 12.27 | 15.73 | 3.46 |
| Apr | 18.17 | 20.78 | 2.61 |
| May | 23.81 | 24.76 | 0.96 |
| Jun | 28.51 | 31.70 | 3.19 |
| Jul | 32.78 | 34.24 | 1.46 |
| Aug | 31.33 | 32.63 | 1.30 |
| Sep | 27.35 | 28.43 | 1.08 |
| Oct | 19.79 | 21.12 | 1.33 |
| Nov | 11.76 | 13.97 | 2.21 |
| Dec | 7.58 | 8.59 | 1.01 |
| ⌀ Month | 18.96 | 21.03 | 2.07 |
Sunshine (h)
| Month | ⌀ 1940 - 1950 | ⌀ 2013 - 2023 | +/- |
|---|---|---|---|
| Jan | 8.35 | 8.09 | -0.26 |
| Feb | 9.13 | 9.38 | 0.25 |
| Mar | 10.47 | 10.24 | -0.23 |
| Apr | 11.79 | 11.84 | 0.05 |
| May | 12.91 | 12.72 | -0.18 |
| Jun | 13.39 | 13.24 | -0.15 |
| Jul | 13.24 | 12.74 | -0.50 |
| Aug | 12.40 | 12.03 | -0.38 |
| Sep | 11.39 | 11.06 | -0.33 |
| Oct | 10.14 | 10.13 | -0.01 |
| Nov | 8.86 | 8.90 | 0.04 |
| Dec | 7.83 | 7.86 | 0.03 |
| ⌀ Month | 10.82 | 10.68 | -0.14 |
Rain (mm)
| Month | ⌀ 1940 - 1950 | ⌀ 2013 - 2023 | +/- |
|---|---|---|---|
| Jan | 0.29 | 0.62 | 0.34 |
| Feb | 0.71 | 0.38 | -0.32 |
| Mar | 0.44 | 0.40 | -0.04 |
| Apr | 0.42 | 0.12 | -0.30 |
| May | 0.11 | 0.12 | 0.01 |
| Jun | 0.04 | 0.07 | 0.03 |
| Jul | 0.13 | 0.29 | 0.16 |
| Aug | 0.36 | 0.53 | 0.17 |
| Sep | 0.10 | 0.37 | 0.26 |
| Oct | 0.27 | 0.17 | -0.10 |
| Nov | 0.35 | 0.34 | -0.01 |
| Dec | 0.63 | 0.41 | -0.22 |
| ⌀ Month | 0.32 | 0.32 | -0.00 |
Snow (mm)
| Month | ⌀ 1940 - 1950 | ⌀ 2013 - 2023 | +/- |
|---|---|---|---|
| Jan | 0.10 | 0.00 | -0.09 |
| Feb | 0.01 | 0.02 | 0.01 |
| Mar | 0.01 | 0.00 | -0.01 |
| Apr | 0.00 | 0.00 | 0.00 |
| May | 0.00 | 0.00 | 0.00 |
| Jun | 0.00 | 0.00 | 0.00 |
| Jul | 0.00 | 0.00 | 0.00 |
| Aug | 0.00 | 0.00 | 0.00 |
| Sep | 0.00 | 0.00 | 0.00 |
| Oct | 0.00 | 0.00 | 0.00 |
| Nov | 0.00 | 0.00 | 0.00 |
| Dec | 0.03 | 0.00 | -0.03 |
| ⌀ Month | 0.01 | 0.00 | -0.01 |