Climate Change Chart of La Plage, France
Comprehensive Climate Change Chart of La Plage, France: Monthly Averages and Impact Trends
Explore the climate change data of La Plagne, France, showcasing the evolution of temperature, rainfall, snowfall, and sunshine duration from 1940 to 1950 compared to 2013 to 2024.
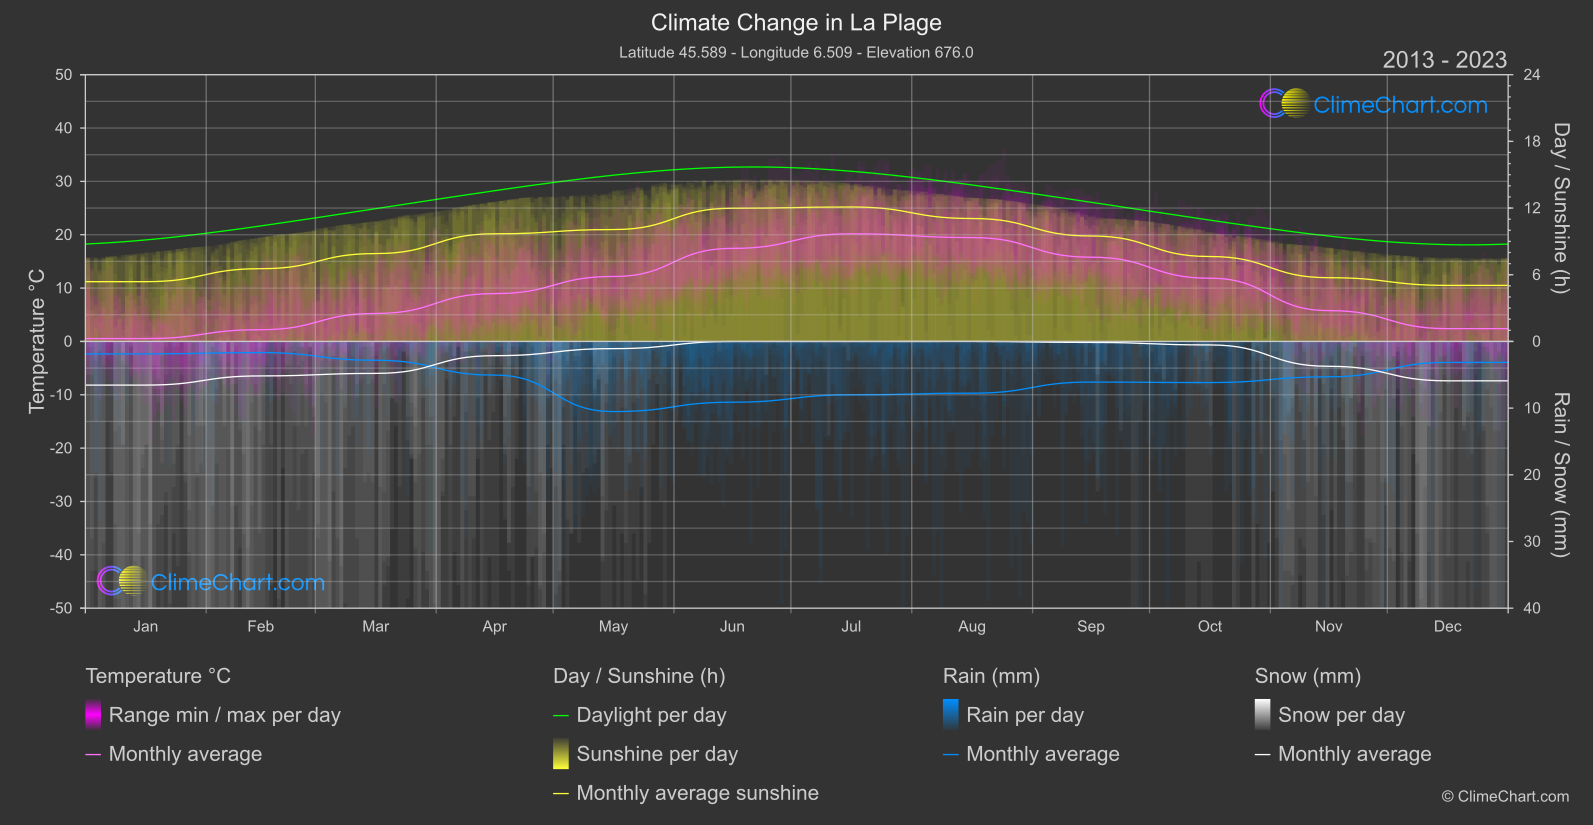
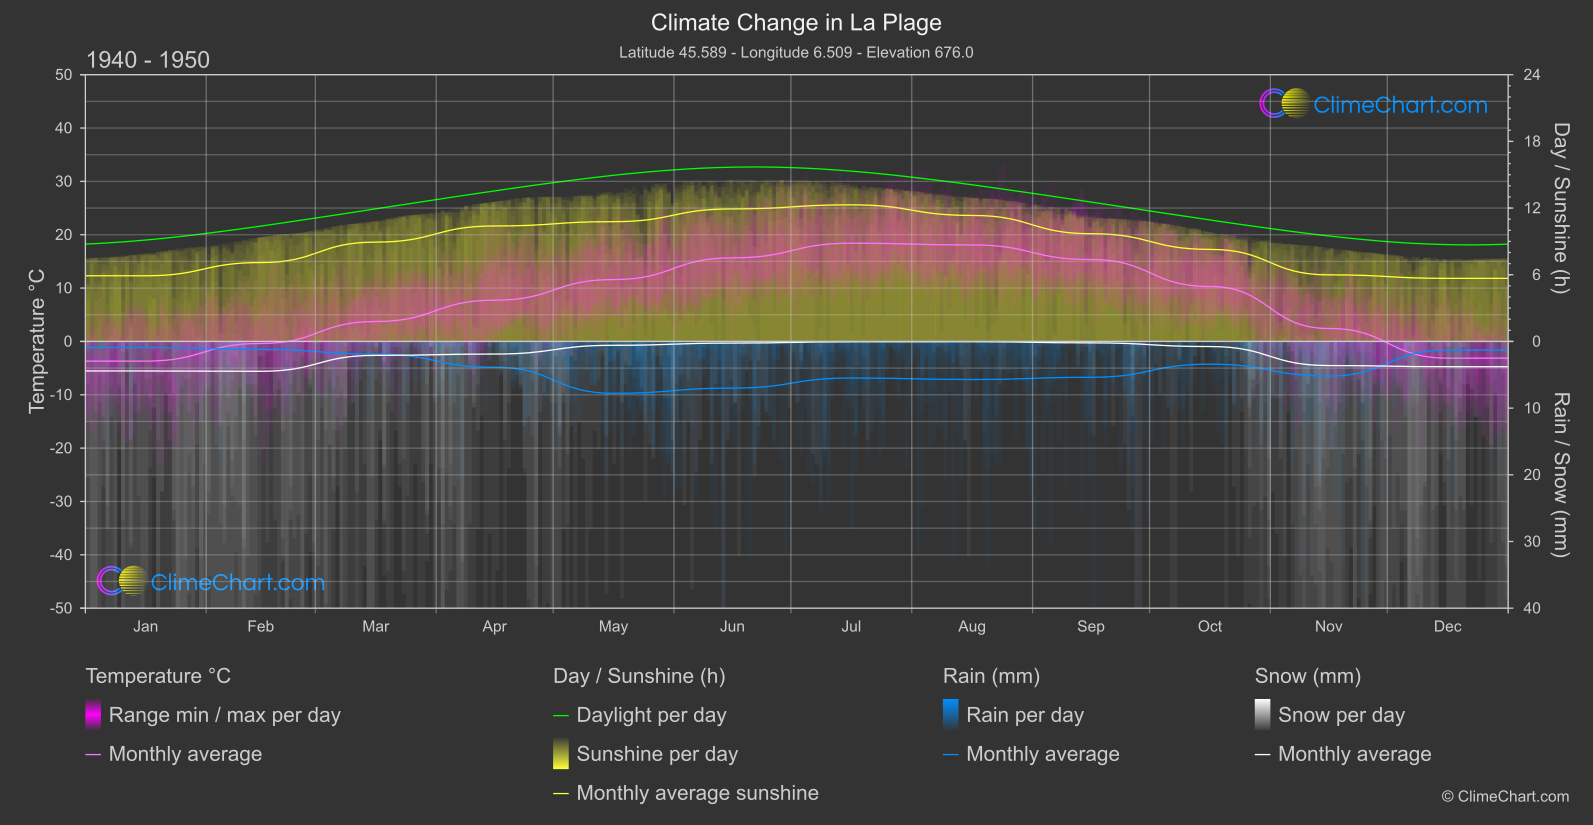
La Plagne, France, experiences notable changes in climate over the years. From January to December, the data shows how temperatures have increased significantly, with some months experiencing a higher rise compared to others. Similarly, the rainfall patterns have also shifted, with certain months witnessing a substantial increase in precipitation. Snowfall and sunshine duration have their own unique trends, highlighting the dynamic nature of the region's weather.
Climate Change Data Overview for La Plage, France
Explore the comprehensive climate change data for La Plage, France. This detailed table provides valuable insights into temperature variations, precipitation levels, and seasonal changes influenced by climate change, helping you understand the unique weather patterns of this region.
Temperature °C
| Month | ⌀ 1940 - 1950 | ⌀ 2013 - 2023 | +/- |
|---|---|---|---|
| Jan | -3.69 | 0.54 | 4.23 |
| Feb | -0.38 | 2.20 | 2.58 |
| Mar | 3.73 | 5.24 | 1.51 |
| Apr | 7.73 | 8.97 | 1.24 |
| May | 11.60 | 12.18 | 0.58 |
| Jun | 15.66 | 17.44 | 1.78 |
| Jul | 18.41 | 20.17 | 1.77 |
| Aug | 18.09 | 19.47 | 1.38 |
| Sep | 15.35 | 15.79 | 0.44 |
| Oct | 10.30 | 11.85 | 1.55 |
| Nov | 2.43 | 5.78 | 3.35 |
| Dec | -3.13 | 2.40 | 5.53 |
| ⌀ Month | 8.01 | 10.17 | 2.16 |
Sunshine (h)
| Month | ⌀ 1940 - 1950 | ⌀ 2013 - 2023 | +/- |
|---|---|---|---|
| Jan | 5.91 | 5.38 | -0.53 |
| Feb | 7.10 | 6.54 | -0.55 |
| Mar | 8.94 | 7.90 | -1.03 |
| Apr | 10.39 | 9.68 | -0.70 |
| May | 10.78 | 10.07 | -0.71 |
| Jun | 11.92 | 11.98 | 0.06 |
| Jul | 12.29 | 12.09 | -0.19 |
| Aug | 11.34 | 11.06 | -0.28 |
| Sep | 9.69 | 9.49 | -0.20 |
| Oct | 8.28 | 7.64 | -0.64 |
| Nov | 5.99 | 5.73 | -0.26 |
| Dec | 5.67 | 5.04 | -0.63 |
| ⌀ Month | 9.02 | 8.55 | -0.47 |
Rain (mm)
| Month | ⌀ 1940 - 1950 | ⌀ 2013 - 2023 | +/- |
|---|---|---|---|
| Jan | 0.46 | 0.93 | 0.48 |
| Feb | 0.59 | 0.84 | 0.25 |
| Mar | 0.95 | 1.41 | 0.46 |
| Apr | 1.94 | 2.52 | 0.59 |
| May | 3.89 | 5.26 | 1.37 |
| Jun | 3.50 | 4.56 | 1.06 |
| Jul | 2.74 | 4.00 | 1.26 |
| Aug | 2.85 | 3.88 | 1.03 |
| Sep | 2.69 | 3.05 | 0.36 |
| Oct | 1.70 | 3.08 | 1.38 |
| Nov | 2.59 | 2.65 | 0.06 |
| Dec | 0.65 | 1.57 | 0.93 |
| ⌀ Month | 2.05 | 2.81 | 0.77 |
Snow (mm)
| Month | ⌀ 1940 - 1950 | ⌀ 2013 - 2023 | +/- |
|---|---|---|---|
| Jan | 2.22 | 3.27 | 1.06 |
| Feb | 2.24 | 2.59 | 0.35 |
| Mar | 1.04 | 2.40 | 1.35 |
| Apr | 0.95 | 1.07 | 0.12 |
| May | 0.29 | 0.54 | 0.25 |
| Jun | 0.12 | 0.01 | -0.12 |
| Jul | 0.03 | 0.01 | -0.02 |
| Aug | 0.02 | 0.00 | -0.02 |
| Sep | 0.11 | 0.08 | -0.03 |
| Oct | 0.38 | 0.26 | -0.12 |
| Nov | 1.81 | 1.86 | 0.06 |
| Dec | 1.90 | 2.95 | 1.06 |
| ⌀ Month | 0.92 | 1.25 | 0.33 |