Climate Change Chart of Kota Kinabalu, Malaysia
Comprehensive Climate Change Chart of Kota Kinabalu, Malaysia: Monthly Averages and Impact Trends
Explore the changing climate in Kota Kinabalu, Malaysia, with insightful data analysis. Discover how temperature, rainfall, and sunshine duration have evolved over the years.
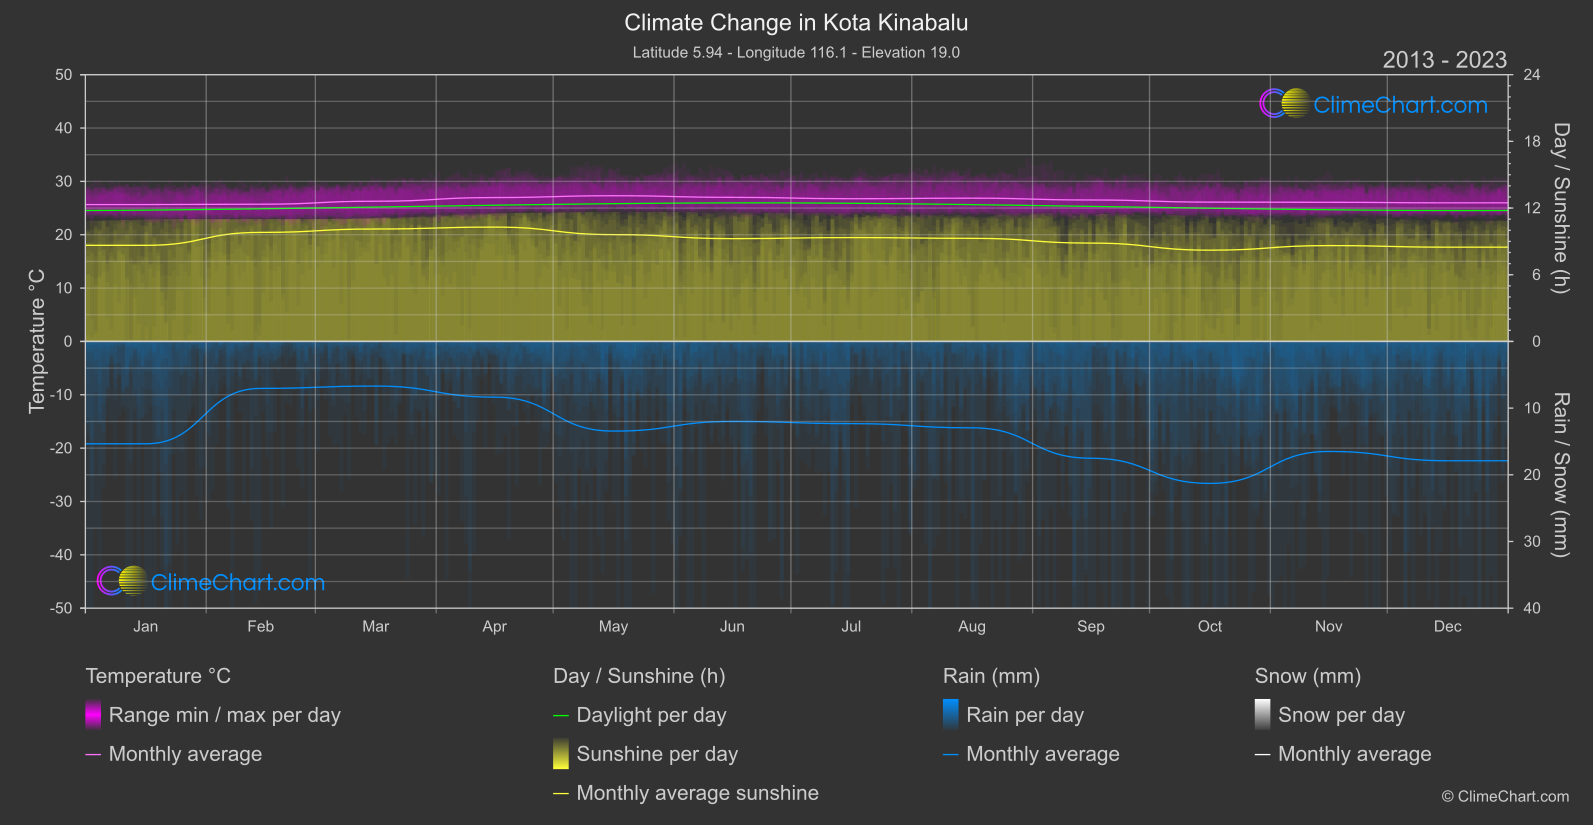
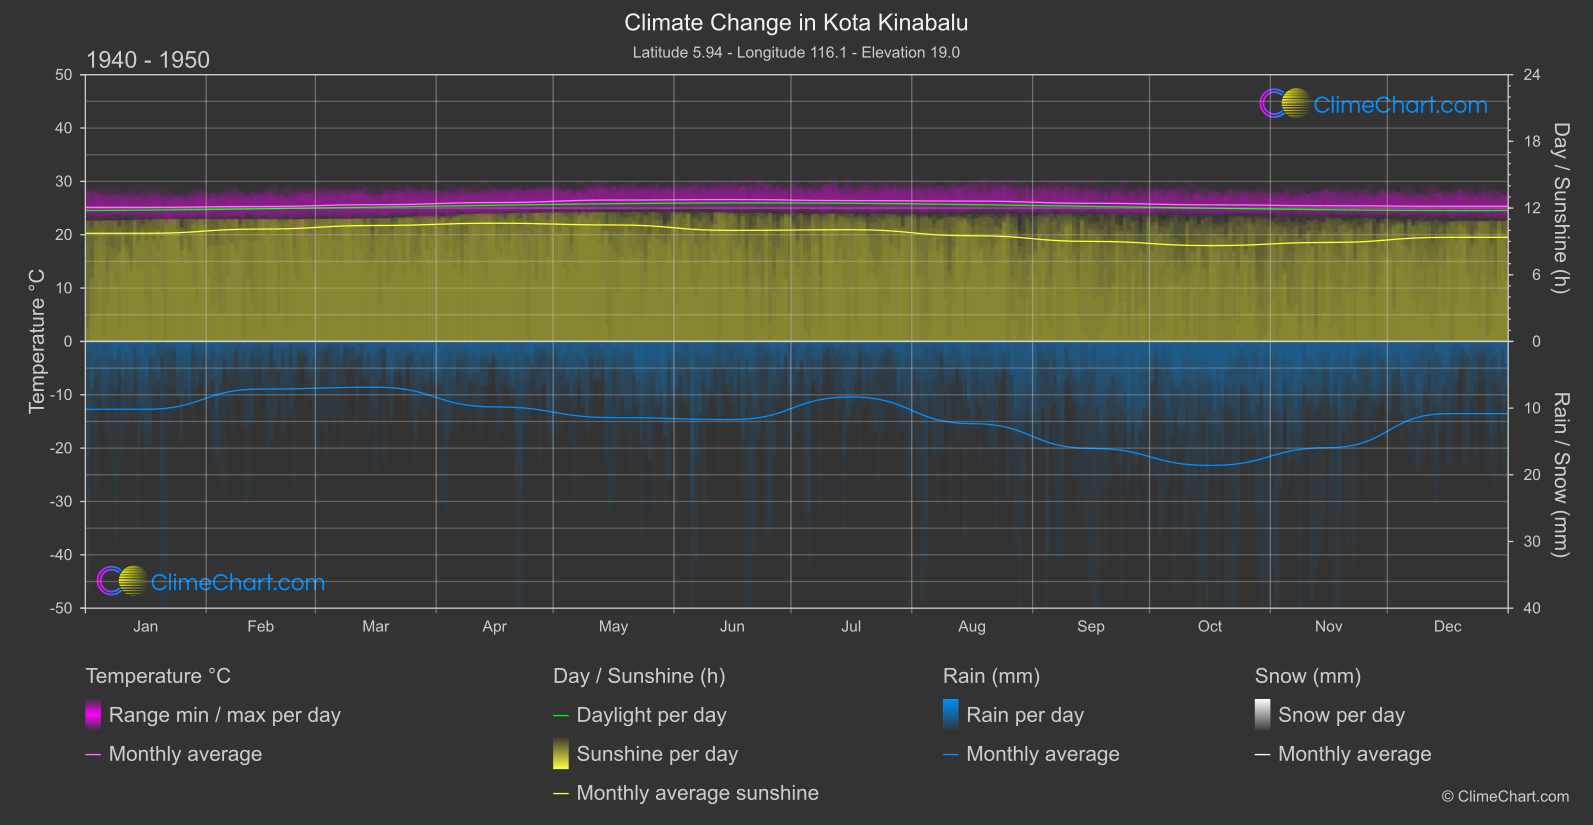
Kota Kinabalu, Malaysia, has witnessed notable changes in its climate over the years. Analyzing the data from 1940 to 1950 compared to 2013 to 2024 reveals interesting insights. For temperature, the month of April shows the highest change with a difference of 0.94°C. In terms of rainfall, December experienced the most significant change, with an increase of 3.53mm. Sunshine duration also varied, with December registering the largest decrease of 0.89 hours.
Climate Change Data Overview for Kota Kinabalu, Malaysia
Explore the comprehensive climate change data for Kota Kinabalu, Malaysia. This detailed table provides valuable insights into temperature variations, precipitation levels, and seasonal changes influenced by climate change, helping you understand the unique weather patterns of this region.
Temperature °C
| Month | ⌀ 1940 - 1950 | ⌀ 2013 - 2023 | +/- |
|---|---|---|---|
| Jan | 25.14 | 25.66 | 0.52 |
| Feb | 25.29 | 25.72 | 0.42 |
| Mar | 25.63 | 26.28 | 0.64 |
| Apr | 26.03 | 26.97 | 0.94 |
| May | 26.50 | 27.31 | 0.81 |
| Jun | 26.59 | 27.01 | 0.42 |
| Jul | 26.40 | 26.75 | 0.35 |
| Aug | 26.31 | 26.85 | 0.55 |
| Sep | 25.89 | 26.51 | 0.62 |
| Oct | 25.61 | 26.11 | 0.51 |
| Nov | 25.44 | 26.08 | 0.64 |
| Dec | 25.32 | 25.98 | 0.65 |
| ⌀ Month | 25.85 | 26.44 | 0.59 |
Sunshine (h)
| Month | ⌀ 1940 - 1950 | ⌀ 2013 - 2023 | +/- |
|---|---|---|---|
| Jan | 9.73 | 8.65 | -1.08 |
| Feb | 10.11 | 9.81 | -0.30 |
| Mar | 10.43 | 10.12 | -0.32 |
| Apr | 10.63 | 10.29 | -0.35 |
| May | 10.48 | 9.61 | -0.87 |
| Jun | 9.99 | 9.25 | -0.74 |
| Jul | 10.05 | 9.34 | -0.71 |
| Aug | 9.51 | 9.28 | -0.23 |
| Sep | 9.00 | 8.85 | -0.15 |
| Oct | 8.62 | 8.21 | -0.41 |
| Nov | 8.91 | 8.62 | -0.28 |
| Dec | 9.37 | 8.48 | -0.89 |
| ⌀ Month | 9.74 | 9.21 | -0.53 |
Rain (mm)
| Month | ⌀ 1940 - 1950 | ⌀ 2013 - 2023 | +/- |
|---|---|---|---|
| Jan | 5.09 | 7.68 | 2.59 |
| Feb | 3.57 | 3.52 | -0.05 |
| Mar | 3.44 | 3.35 | -0.09 |
| Apr | 4.91 | 4.18 | -0.73 |
| May | 5.71 | 6.72 | 1.01 |
| Jun | 5.86 | 6.00 | 0.14 |
| Jul | 4.17 | 6.16 | 2.00 |
| Aug | 6.16 | 6.48 | 0.32 |
| Sep | 8.02 | 8.76 | 0.74 |
| Oct | 9.30 | 10.65 | 1.35 |
| Nov | 7.96 | 8.25 | 0.28 |
| Dec | 5.41 | 8.95 | 3.53 |
| ⌀ Month | 5.80 | 6.72 | 0.92 |
Snow (mm)
| Month | ⌀ 1940 - 1950 | ⌀ 2013 - 2023 | +/- |
|---|---|---|---|
| Jan | 0.00 | 0.00 | 0.00 |
| Feb | 0.00 | 0.00 | 0.00 |
| Mar | 0.00 | 0.00 | 0.00 |
| Apr | 0.00 | 0.00 | 0.00 |
| May | 0.00 | 0.00 | 0.00 |
| Jun | 0.00 | 0.00 | 0.00 |
| Jul | 0.00 | 0.00 | 0.00 |
| Aug | 0.00 | 0.00 | 0.00 |
| Sep | 0.00 | 0.00 | 0.00 |
| Oct | 0.00 | 0.00 | 0.00 |
| Nov | 0.00 | 0.00 | 0.00 |
| Dec | 0.00 | 0.00 | 0.00 |
| ⌀ Month | 0.00 | 0.00 | 0.00 |