Climate Change Chart of Koh Yao Noi, Thailand
Comprehensive Climate Change Chart of Koh Yao Noi, Thailand: Monthly Averages and Impact Trends
Exploring the climate changes in Koh Yao Noi, Thailand reveals intriguing insights into the shifting weather patterns over the years. Discover how temperature, rainfall, and sunshine duration have evolved from 1940 to 1950 compared to 2013 to 2024.
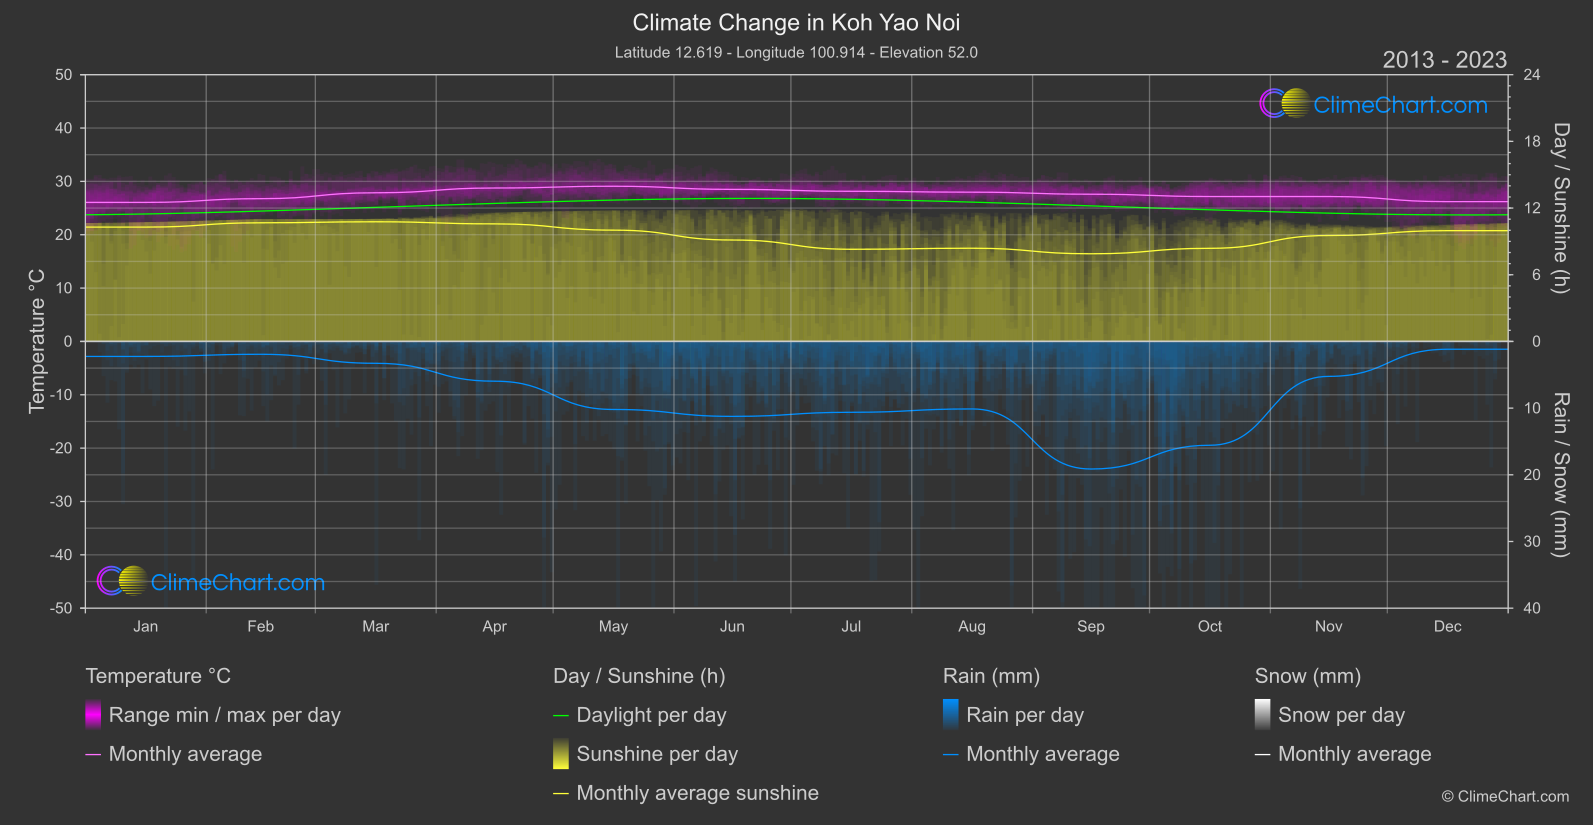
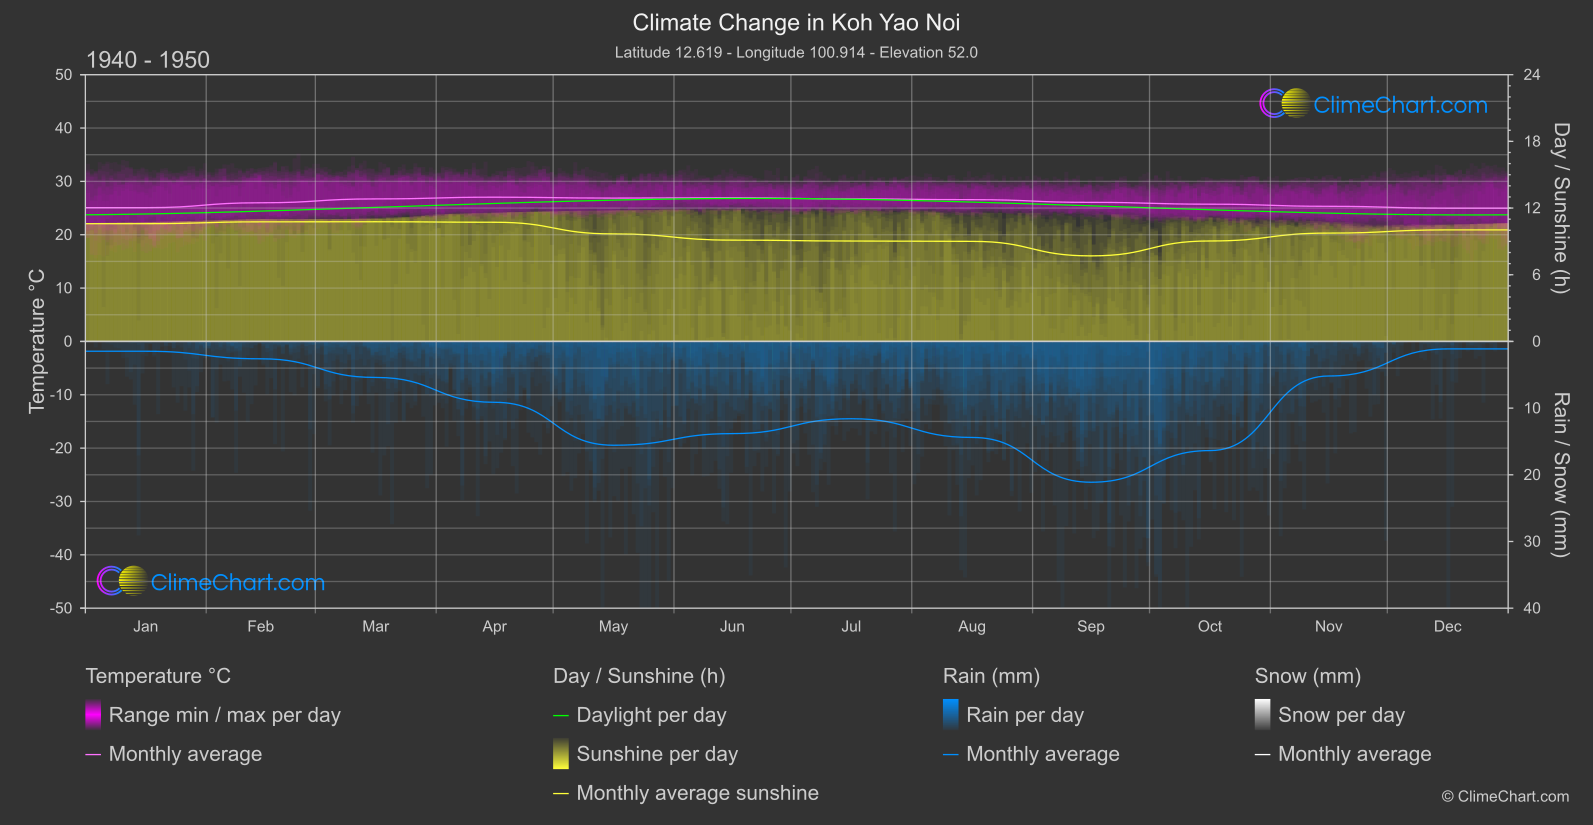
Delve deeper into the climate and weather trends in Koh Yao Noi, Thailand, to understand the impact of climate change. The data showcases a noticeable increase in temperature across most months, with May experiencing the highest temperature change of 2.22°C. In terms of rainfall, there is a general decrease in precipitation levels, with April showing the most significant decline of 1.58mm. Additionally, the sunshine duration has fluctuated, with July witnessing a notable decrease in sunshine hours compared to the past.
Climate Change Data Overview for Koh Yao Noi, Thailand
Explore the comprehensive climate change data for Koh Yao Noi, Thailand. This detailed table provides valuable insights into temperature variations, precipitation levels, and seasonal changes influenced by climate change, helping you understand the unique weather patterns of this region.
Temperature °C
| Month | ⌀ 1940 - 1950 | ⌀ 2013 - 2023 | +/- |
|---|---|---|---|
| Jan | 25.07 | 26.06 | 0.99 |
| Feb | 25.99 | 26.76 | 0.77 |
| Mar | 26.71 | 27.86 | 1.15 |
| Apr | 27.04 | 28.76 | 1.72 |
| May | 26.87 | 29.09 | 2.22 |
| Jun | 26.93 | 28.50 | 1.57 |
| Jul | 26.72 | 28.14 | 1.43 |
| Aug | 26.57 | 27.98 | 1.40 |
| Sep | 26.06 | 27.59 | 1.53 |
| Oct | 25.73 | 27.16 | 1.44 |
| Nov | 25.33 | 27.16 | 1.84 |
| Dec | 24.97 | 26.20 | 1.23 |
| ⌀ Month | 26.17 | 27.61 | 1.44 |
Sunshine (h)
| Month | ⌀ 1940 - 1950 | ⌀ 2013 - 2023 | +/- |
|---|---|---|---|
| Jan | 10.59 | 10.29 | -0.31 |
| Feb | 10.76 | 10.67 | -0.09 |
| Mar | 10.77 | 10.77 | -0.00 |
| Apr | 10.72 | 10.58 | -0.15 |
| May | 9.67 | 10.01 | 0.34 |
| Jun | 9.11 | 9.13 | 0.01 |
| Jul | 9.04 | 8.29 | -0.74 |
| Aug | 9.00 | 8.39 | -0.62 |
| Sep | 7.70 | 7.89 | 0.19 |
| Oct | 9.04 | 8.38 | -0.66 |
| Nov | 9.75 | 9.53 | -0.22 |
| Dec | 10.04 | 9.97 | -0.07 |
| ⌀ Month | 9.68 | 9.49 | -0.19 |
Rain (mm)
| Month | ⌀ 1940 - 1950 | ⌀ 2013 - 2023 | +/- |
|---|---|---|---|
| Jan | 0.74 | 1.12 | 0.39 |
| Feb | 1.30 | 0.96 | -0.34 |
| Mar | 2.70 | 1.64 | -1.06 |
| Apr | 4.56 | 2.98 | -1.58 |
| May | 7.78 | 5.10 | -2.68 |
| Jun | 6.91 | 5.62 | -1.29 |
| Jul | 5.80 | 5.31 | -0.48 |
| Aug | 7.20 | 5.06 | -2.14 |
| Sep | 10.56 | 9.57 | -0.99 |
| Oct | 8.18 | 7.78 | -0.40 |
| Nov | 2.59 | 2.62 | 0.03 |
| Dec | 0.56 | 0.59 | 0.02 |
| ⌀ Month | 4.91 | 4.03 | -0.88 |
Snow (mm)
| Month | ⌀ 1940 - 1950 | ⌀ 2013 - 2023 | +/- |
|---|---|---|---|
| Jan | 0.00 | 0.00 | 0.00 |
| Feb | 0.00 | 0.00 | 0.00 |
| Mar | 0.00 | 0.00 | 0.00 |
| Apr | 0.00 | 0.00 | 0.00 |
| May | 0.00 | 0.00 | 0.00 |
| Jun | 0.00 | 0.00 | 0.00 |
| Jul | 0.00 | 0.00 | 0.00 |
| Aug | 0.00 | 0.00 | 0.00 |
| Sep | 0.00 | 0.00 | 0.00 |
| Oct | 0.00 | 0.00 | 0.00 |
| Nov | 0.00 | 0.00 | 0.00 |
| Dec | 0.00 | 0.00 | 0.00 |
| ⌀ Month | 0.00 | 0.00 | 0.00 |