Climate Change Chart of Kitzbühel, Austria
Comprehensive Climate Change Chart of Kitzbühel, Austria: Monthly Averages and Impact Trends
Explore the climate change data for Kitzbühel, Austria, showcasing the temperature, rainfall, snowfall, and sunshine duration trends from 1940-1950 compared to 2013-2024.
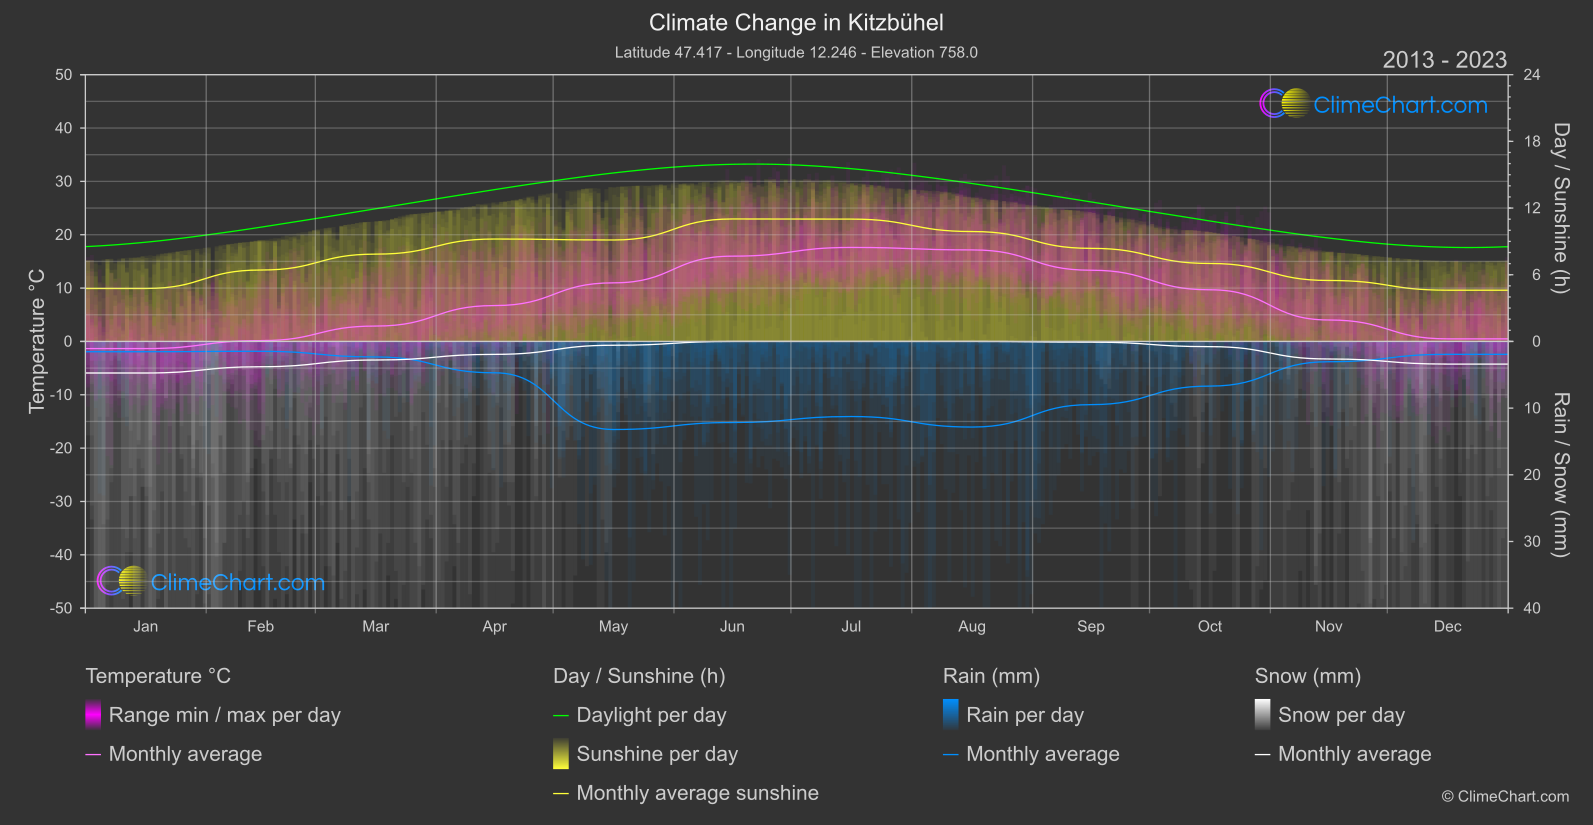
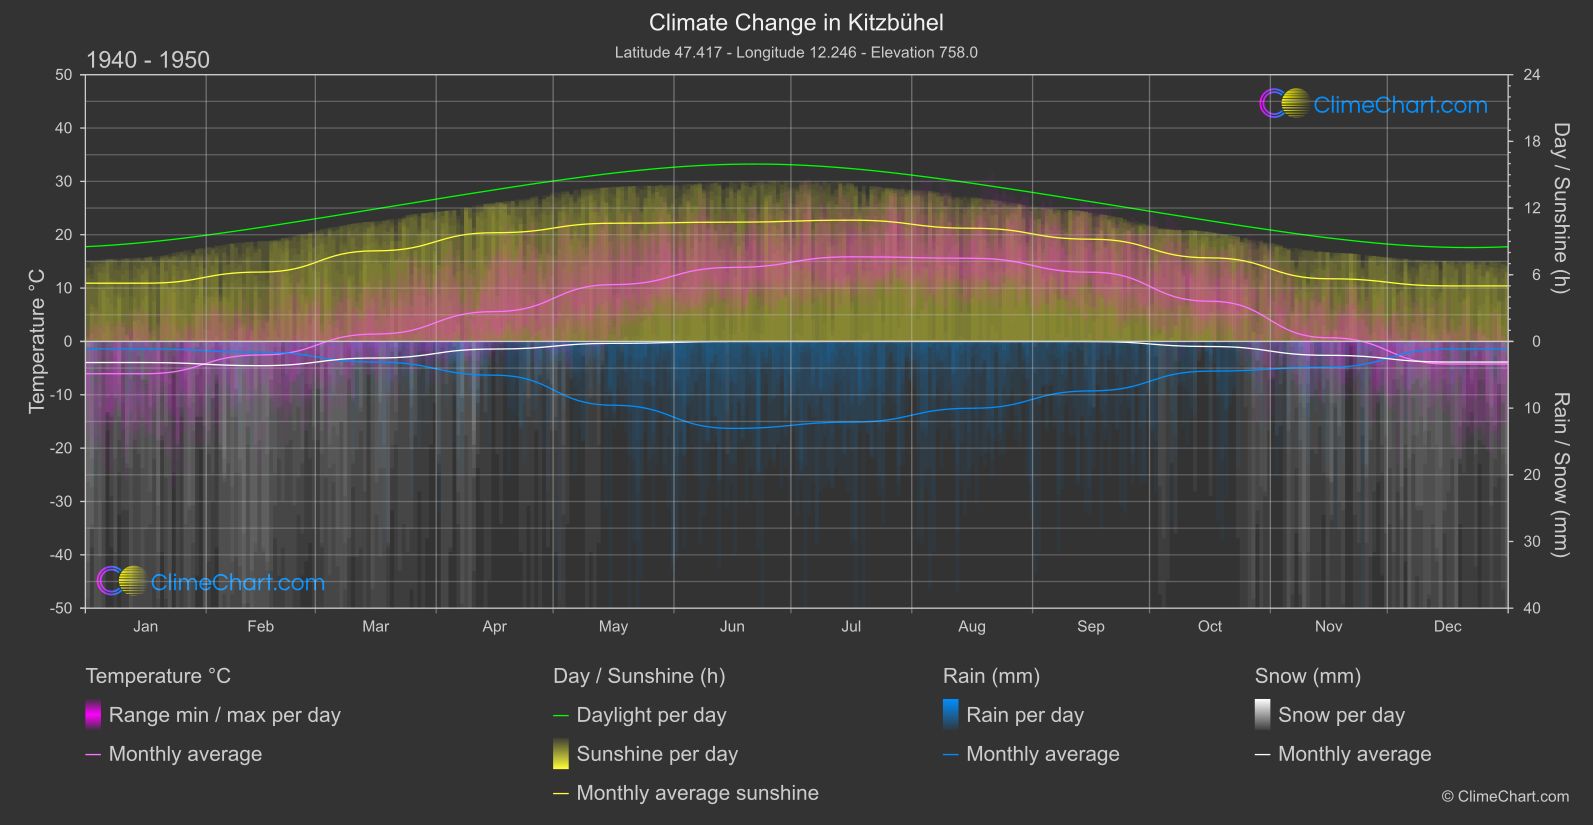
The data reveals significant changes in temperature, rainfall, snowfall, and sunshine duration in Kitzbühel, Austria, over the years. Notably, December shows the highest temperature change of 4.71°C, while May has the highest rainfall change of 1.82mm. Snowfall has decreased in most months, with April experiencing the most significant drop of 0.40mm. Sunshine duration also varies, with May showing the largest decrease of 1.51 hours.
Climate Change Data Overview for Kitzbühel, Austria
Explore the comprehensive climate change data for Kitzbühel, Austria. This detailed table provides valuable insights into temperature variations, precipitation levels, and seasonal changes influenced by climate change, helping you understand the unique weather patterns of this region.
Temperature °C
| Month | ⌀ 1940 - 1950 | ⌀ 2013 - 2023 | +/- |
|---|---|---|---|
| Jan | -6.05 | -1.34 | 4.71 |
| Feb | -2.53 | 0.15 | 2.68 |
| Mar | 1.39 | 2.88 | 1.50 |
| Apr | 5.60 | 6.72 | 1.13 |
| May | 10.65 | 10.98 | 0.33 |
| Jun | 13.87 | 15.98 | 2.11 |
| Jul | 15.86 | 17.62 | 1.75 |
| Aug | 15.59 | 17.15 | 1.57 |
| Sep | 12.97 | 13.35 | 0.37 |
| Oct | 7.54 | 9.68 | 2.15 |
| Nov | 0.69 | 4.02 | 3.33 |
| Dec | -4.23 | 0.48 | 4.71 |
| ⌀ Month | 5.95 | 8.14 | 2.20 |
Sunshine (h)
| Month | ⌀ 1940 - 1950 | ⌀ 2013 - 2023 | +/- |
|---|---|---|---|
| Jan | 5.24 | 4.77 | -0.47 |
| Feb | 6.24 | 6.42 | 0.18 |
| Mar | 8.15 | 7.85 | -0.30 |
| Apr | 9.78 | 9.21 | -0.57 |
| May | 10.63 | 9.13 | -1.51 |
| Jun | 10.73 | 11.02 | 0.29 |
| Jul | 10.91 | 11.01 | 0.10 |
| Aug | 10.18 | 9.89 | -0.30 |
| Sep | 9.20 | 8.38 | -0.82 |
| Oct | 7.52 | 7.01 | -0.51 |
| Nov | 5.64 | 5.48 | -0.15 |
| Dec | 5.00 | 4.61 | -0.39 |
| ⌀ Month | 8.27 | 7.90 | -0.37 |
Rain (mm)
| Month | ⌀ 1940 - 1950 | ⌀ 2013 - 2023 | +/- |
|---|---|---|---|
| Jan | 0.56 | 0.77 | 0.22 |
| Feb | 0.81 | 0.74 | -0.07 |
| Mar | 1.55 | 1.16 | -0.38 |
| Apr | 2.53 | 2.35 | -0.18 |
| May | 4.78 | 6.60 | 1.82 |
| Jun | 6.52 | 6.08 | -0.44 |
| Jul | 6.05 | 5.63 | -0.42 |
| Aug | 5.01 | 6.42 | 1.41 |
| Sep | 3.71 | 4.74 | 1.03 |
| Oct | 2.23 | 3.35 | 1.12 |
| Nov | 1.93 | 1.52 | -0.41 |
| Dec | 0.56 | 0.97 | 0.41 |
| ⌀ Month | 3.02 | 3.36 | 0.34 |
Snow (mm)
| Month | ⌀ 1940 - 1950 | ⌀ 2013 - 2023 | +/- |
|---|---|---|---|
| Jan | 1.58 | 2.37 | 0.78 |
| Feb | 1.82 | 1.90 | 0.08 |
| Mar | 1.24 | 1.39 | 0.15 |
| Apr | 0.57 | 0.97 | 0.40 |
| May | 0.14 | 0.29 | 0.14 |
| Jun | 0.01 | 0.00 | -0.01 |
| Jul | 0.00 | 0.00 | 0.00 |
| Aug | 0.00 | 0.00 | -0.00 |
| Sep | 0.01 | 0.05 | 0.05 |
| Oct | 0.38 | 0.39 | 0.01 |
| Nov | 1.04 | 1.32 | 0.27 |
| Dec | 1.55 | 1.70 | 0.15 |
| ⌀ Month | 0.69 | 0.86 | 0.17 |