Climate Change Chart of Kirkwood, USA
Comprehensive Climate Change Chart of Kirkwood, USA: Monthly Averages and Impact Trends
Exploring the changing climate in Kirkwood, United States of America.
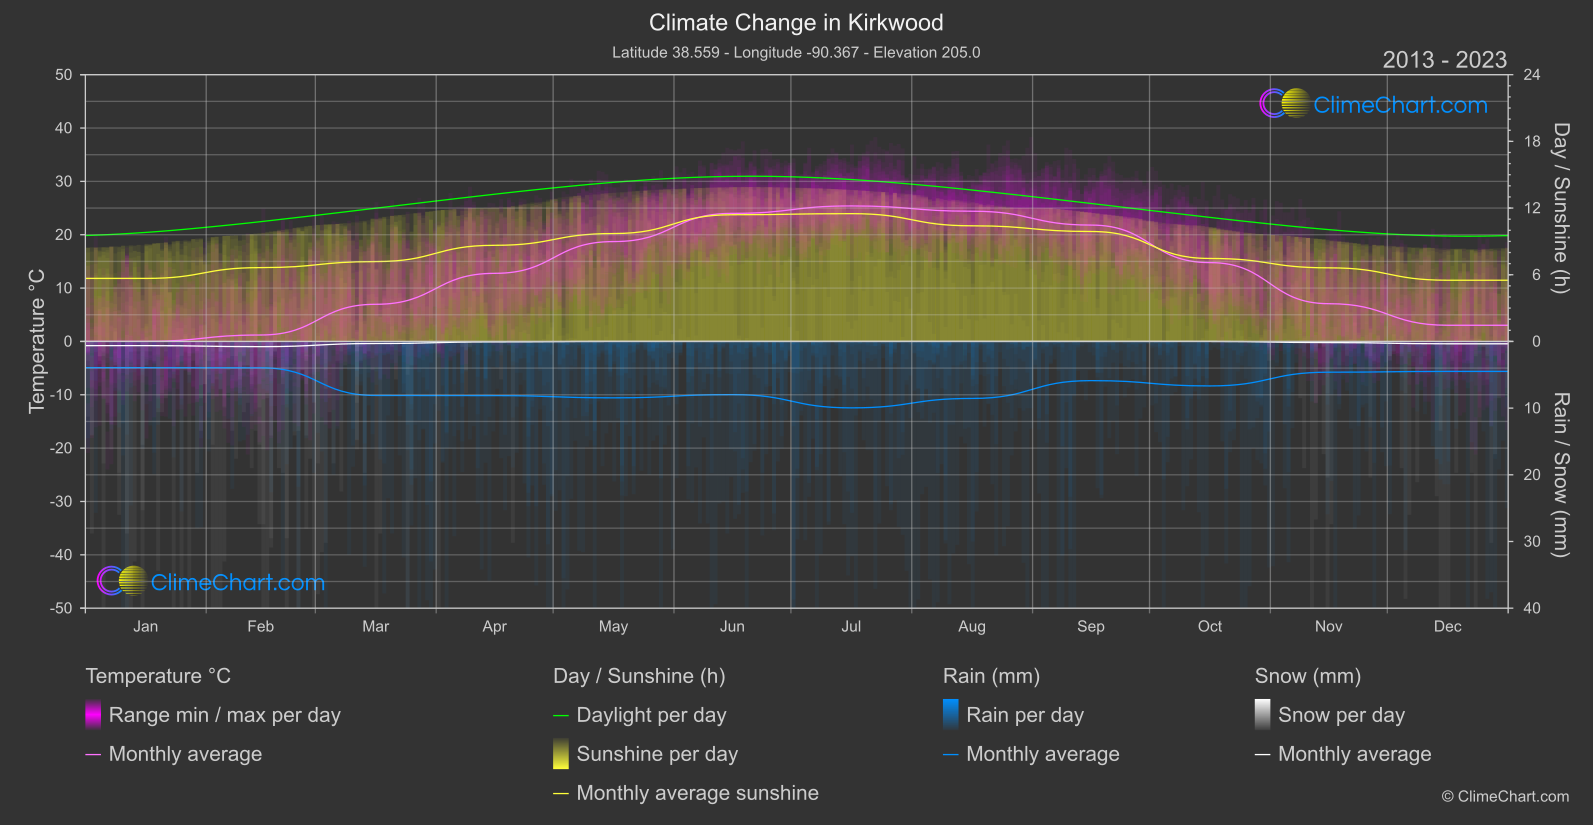
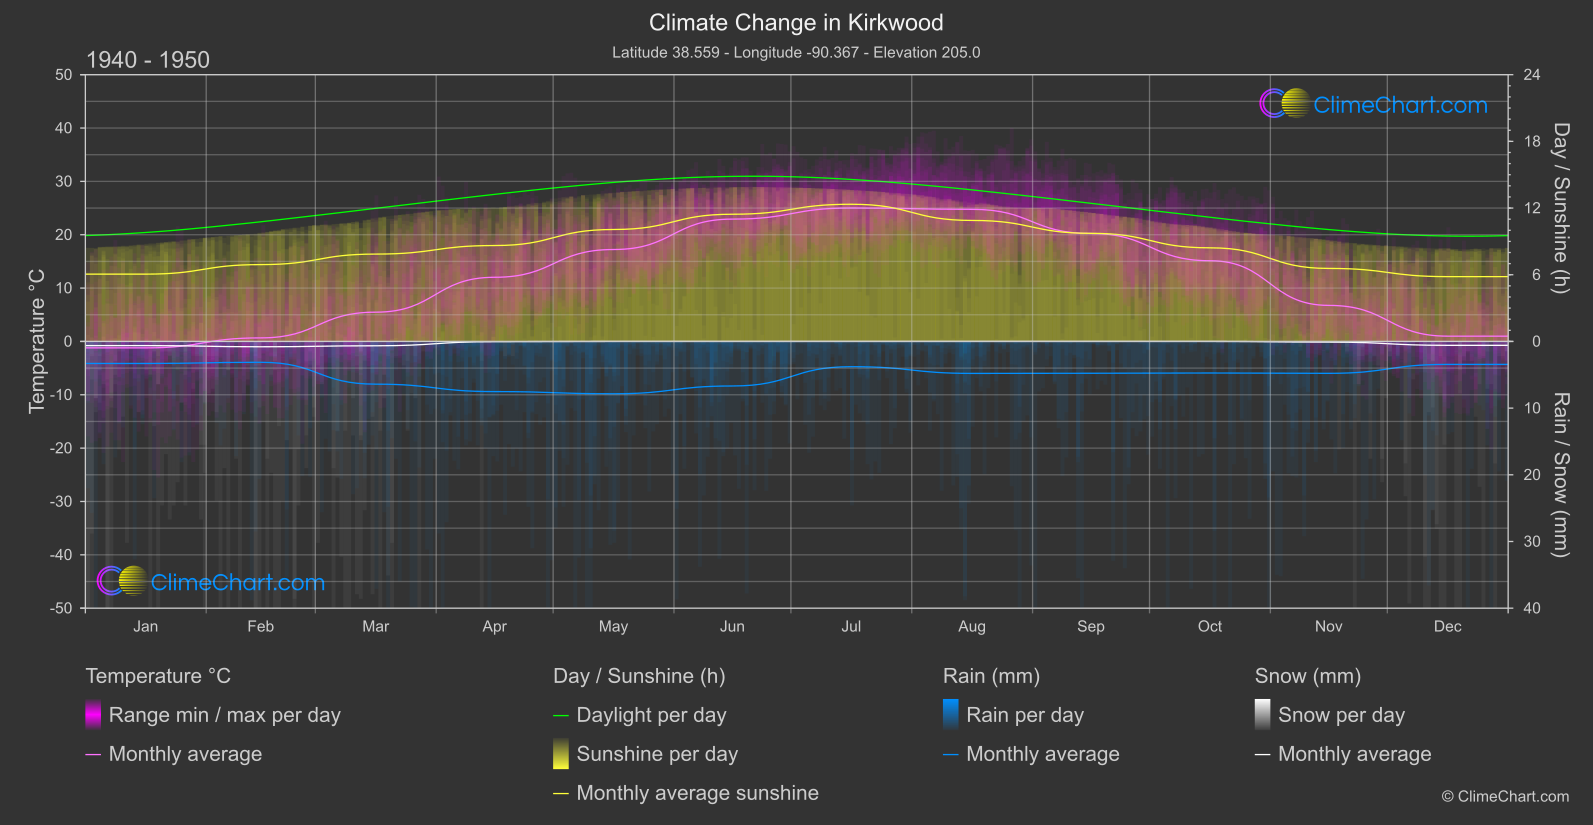
Kirkwood, United States of America, has witnessed significant changes in temperature, rainfall, snowfall, and sunshine duration over the years. Analyzing the data from 1940 to 1950 compared to 2013 to 2024 reveals interesting insights. For instance, the month with the highest temperature change is December, experiencing a 2.04°C increase. In terms of rainfall, July shows the most dramatic change with a 3.09 mm increase. Snowfall has reduced in several months, notably in August where there is no recorded snowfall in recent years. Sunshine duration has fluctuated, with the biggest decrease seen in July at 0.85 hours.
Climate Change Data Overview for Kirkwood, USA
Explore the comprehensive climate change data for Kirkwood, USA. This detailed table provides valuable insights into temperature variations, precipitation levels, and seasonal changes influenced by climate change, helping you understand the unique weather patterns of this region.
Temperature °C
| Month | ⌀ 1940 - 1950 | ⌀ 2013 - 2023 | +/- |
|---|---|---|---|
| Jan | -1.21 | 0.01 | 1.22 |
| Feb | 0.66 | 1.20 | 0.54 |
| Mar | 5.48 | 6.96 | 1.48 |
| Apr | 12.02 | 12.76 | 0.74 |
| May | 17.23 | 18.72 | 1.49 |
| Jun | 22.93 | 24.00 | 1.07 |
| Jul | 25.01 | 25.40 | 0.39 |
| Aug | 24.76 | 24.41 | -0.35 |
| Sep | 20.23 | 21.81 | 1.58 |
| Oct | 15.12 | 14.78 | -0.35 |
| Nov | 6.75 | 7.07 | 0.32 |
| Dec | 0.99 | 3.03 | 2.04 |
| ⌀ Month | 12.50 | 13.35 | 0.85 |
Sunshine (h)
| Month | ⌀ 1940 - 1950 | ⌀ 2013 - 2023 | +/- |
|---|---|---|---|
| Jan | 6.05 | 5.67 | -0.38 |
| Feb | 6.91 | 6.64 | -0.27 |
| Mar | 7.86 | 7.18 | -0.67 |
| Apr | 8.63 | 8.65 | 0.02 |
| May | 10.07 | 9.71 | -0.36 |
| Jun | 11.44 | 11.40 | -0.05 |
| Jul | 12.34 | 11.50 | -0.85 |
| Aug | 10.89 | 10.40 | -0.48 |
| Sep | 9.73 | 9.89 | 0.17 |
| Oct | 8.42 | 7.47 | -0.96 |
| Nov | 6.57 | 6.62 | 0.05 |
| Dec | 5.83 | 5.51 | -0.32 |
| ⌀ Month | 8.73 | 8.39 | -0.34 |
Rain (mm)
| Month | ⌀ 1940 - 1950 | ⌀ 2013 - 2023 | +/- |
|---|---|---|---|
| Jan | 1.65 | 1.97 | 0.32 |
| Feb | 1.56 | 1.98 | 0.42 |
| Mar | 3.20 | 4.05 | 0.85 |
| Apr | 3.76 | 4.06 | 0.30 |
| May | 3.92 | 4.23 | 0.30 |
| Jun | 3.34 | 3.99 | 0.65 |
| Jul | 1.89 | 4.98 | 3.09 |
| Aug | 2.40 | 4.27 | 1.88 |
| Sep | 2.39 | 2.94 | 0.55 |
| Oct | 2.37 | 3.34 | 0.97 |
| Nov | 2.39 | 2.31 | -0.09 |
| Dec | 1.72 | 2.25 | 0.53 |
| ⌀ Month | 2.55 | 3.36 | 0.81 |
Snow (mm)
| Month | ⌀ 1940 - 1950 | ⌀ 2013 - 2023 | +/- |
|---|---|---|---|
| Jan | 0.31 | 0.31 | 0.00 |
| Feb | 0.40 | 0.39 | -0.01 |
| Mar | 0.33 | 0.16 | -0.17 |
| Apr | 0.02 | 0.03 | 0.01 |
| May | 0.00 | 0.00 | 0.00 |
| Jun | 0.00 | 0.00 | 0.00 |
| Jul | 0.00 | 0.00 | 0.00 |
| Aug | 0.00 | 0.00 | 0.00 |
| Sep | 0.00 | 0.00 | 0.00 |
| Oct | 0.00 | 0.00 | 0.00 |
| Nov | 0.05 | 0.09 | 0.04 |
| Dec | 0.29 | 0.18 | -0.12 |
| ⌀ Month | 0.12 | 0.10 | -0.02 |