Climate Change Chart of Kazan, Russian Federation
Comprehensive Climate Change Chart of Kazan, Russian Federation: Monthly Averages and Impact Trends
Exploring the changing climate in Kazan, Russian Federation reveals intriguing insights into temperature, rainfall, snowfall, and sunshine duration trends. Dive into the data to uncover how climate patterns have evolved over the years.
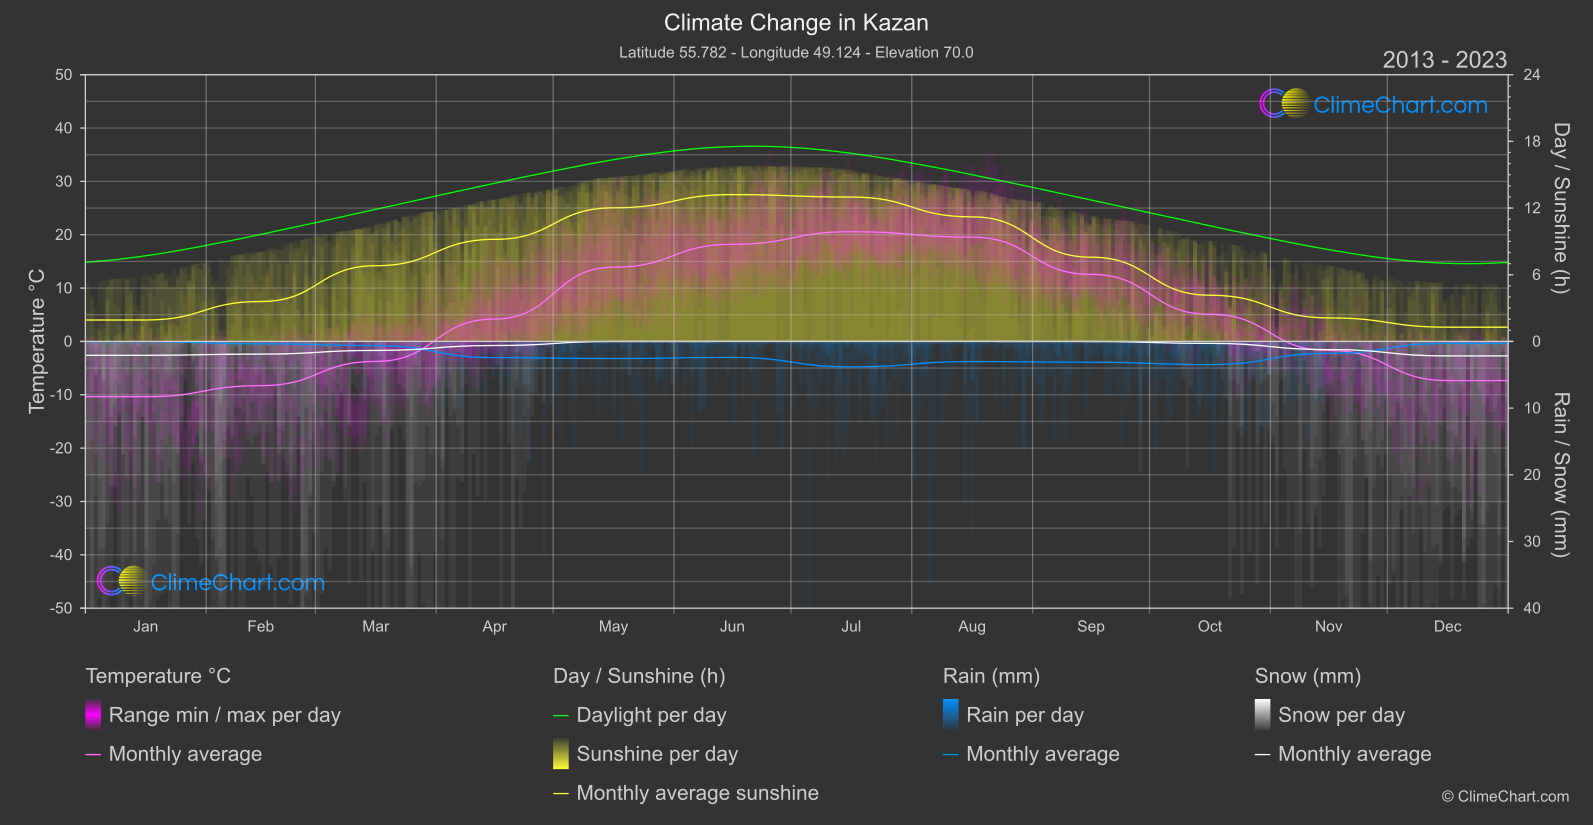
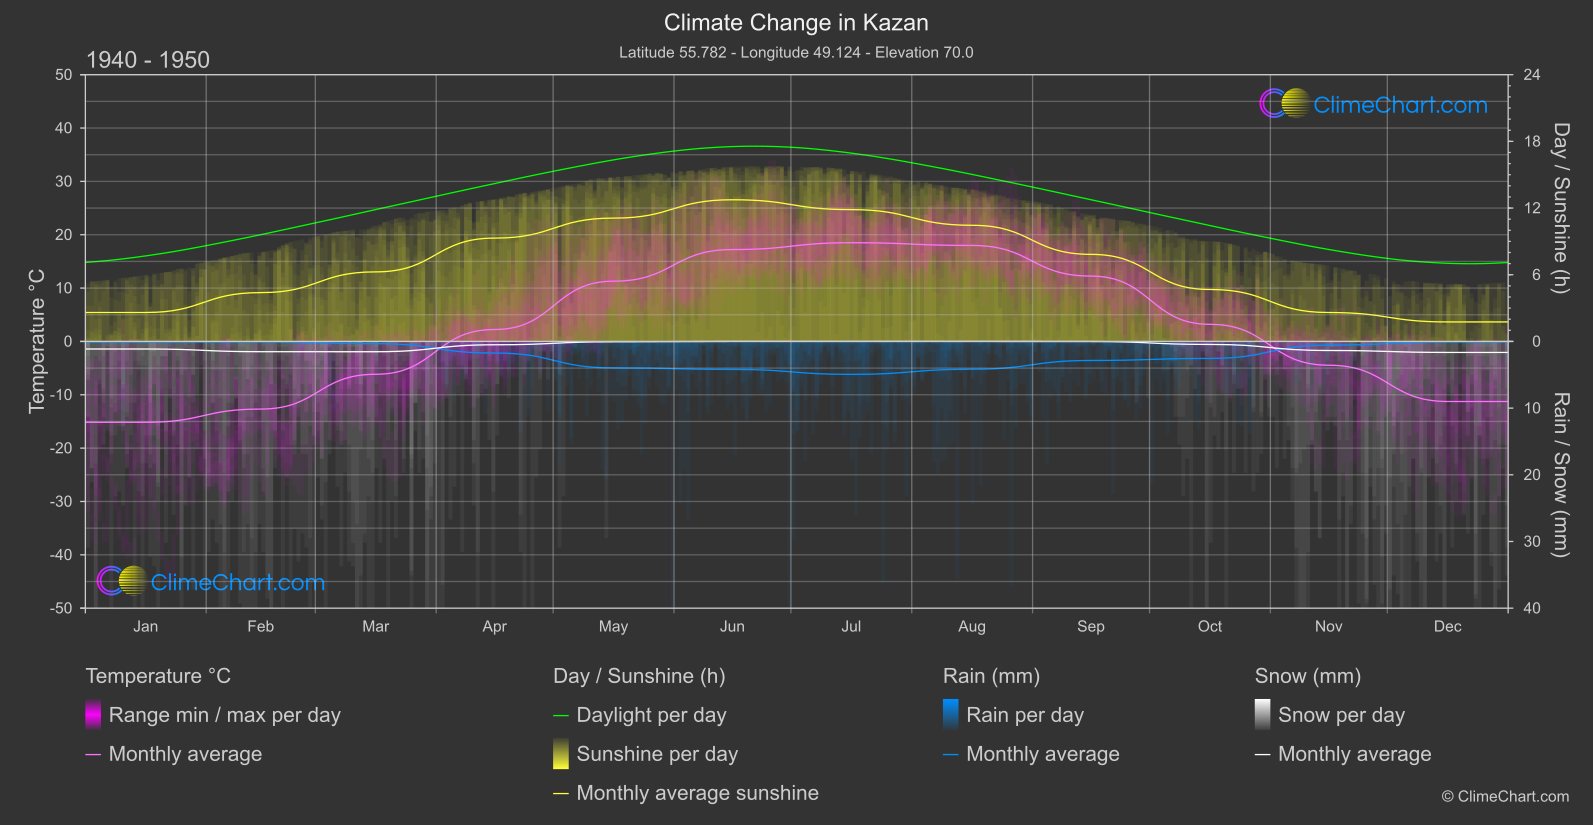
Kazan, a city in the Russian Federation, has experienced notable changes in its climate over the years. From January to December, the temperature, rainfall, snowfall, and sunshine duration have shown varying patterns. Notably, the month with the highest temperature change is May, while the month with the highest rainfall change is November. Explore the data further to gain a deeper understanding of how climate change is impacting Kazan.
Climate Change Data Overview for Kazan, Russian Federation
Explore the comprehensive climate change data for Kazan, Russian Federation. This detailed table provides valuable insights into temperature variations, precipitation levels, and seasonal changes influenced by climate change, helping you understand the unique weather patterns of this region.
Temperature °C
| Month | ⌀ 1940 - 1950 | ⌀ 2013 - 2023 | +/- |
|---|---|---|---|
| Jan | -15.16 | -10.36 | 4.80 |
| Feb | -12.68 | -8.29 | 4.39 |
| Mar | -6.16 | -3.74 | 2.41 |
| Apr | 2.24 | 4.19 | 1.96 |
| May | 11.30 | 13.91 | 2.62 |
| Jun | 17.22 | 18.21 | 0.98 |
| Jul | 18.50 | 20.57 | 2.07 |
| Aug | 17.99 | 19.54 | 1.55 |
| Sep | 12.25 | 12.57 | 0.32 |
| Oct | 3.20 | 5.08 | 1.88 |
| Nov | -4.46 | -1.69 | 2.77 |
| Dec | -11.26 | -7.33 | 3.93 |
| ⌀ Month | 2.75 | 5.22 | 2.47 |
Sunshine (h)
| Month | ⌀ 1940 - 1950 | ⌀ 2013 - 2023 | +/- |
|---|---|---|---|
| Jan | 2.60 | 1.93 | -0.68 |
| Feb | 4.39 | 3.59 | -0.80 |
| Mar | 6.26 | 6.81 | 0.55 |
| Apr | 9.30 | 9.18 | -0.11 |
| May | 11.10 | 12.02 | 0.93 |
| Jun | 12.75 | 13.21 | 0.46 |
| Jul | 11.86 | 12.99 | 1.13 |
| Aug | 10.45 | 11.21 | 0.76 |
| Sep | 7.83 | 7.58 | -0.25 |
| Oct | 4.67 | 4.16 | -0.52 |
| Nov | 2.60 | 2.12 | -0.49 |
| Dec | 1.75 | 1.28 | -0.47 |
| ⌀ Month | 7.13 | 7.17 | 0.04 |
Rain (mm)
| Month | ⌀ 1940 - 1950 | ⌀ 2013 - 2023 | +/- |
|---|---|---|---|
| Jan | 0.04 | 0.03 | -0.02 |
| Feb | 0.04 | 0.17 | 0.13 |
| Mar | 0.16 | 0.31 | 0.15 |
| Apr | 0.87 | 1.21 | 0.35 |
| May | 1.98 | 1.28 | -0.70 |
| Jun | 2.10 | 1.20 | -0.90 |
| Jul | 2.47 | 1.91 | -0.56 |
| Aug | 2.08 | 1.51 | -0.57 |
| Sep | 1.43 | 1.56 | 0.13 |
| Oct | 1.28 | 1.74 | 0.46 |
| Nov | 0.28 | 0.89 | 0.62 |
| Dec | 0.04 | 0.14 | 0.11 |
| ⌀ Month | 1.06 | 1.00 | -0.07 |
Snow (mm)
| Month | ⌀ 1940 - 1950 | ⌀ 2013 - 2023 | +/- |
|---|---|---|---|
| Jan | 0.57 | 1.04 | 0.47 |
| Feb | 0.77 | 0.95 | 0.18 |
| Mar | 0.77 | 0.67 | -0.10 |
| Apr | 0.25 | 0.30 | 0.05 |
| May | 0.03 | 0.00 | -0.02 |
| Jun | 0.00 | 0.00 | 0.00 |
| Jul | 0.00 | 0.00 | 0.00 |
| Aug | 0.00 | 0.00 | 0.00 |
| Sep | 0.01 | 0.01 | 0.00 |
| Oct | 0.22 | 0.14 | -0.08 |
| Nov | 0.68 | 0.61 | -0.07 |
| Dec | 0.82 | 1.08 | 0.26 |
| ⌀ Month | 0.34 | 0.40 | 0.06 |