Climate Change Chart of Kawasaki, Japan
Comprehensive Climate Change Chart of Kawasaki, Japan: Monthly Averages and Impact Trends
Explore the changing climate in Kawasaki, Japan with insightful data analysis. Discover the impact of temperature and rainfall variations over decades.
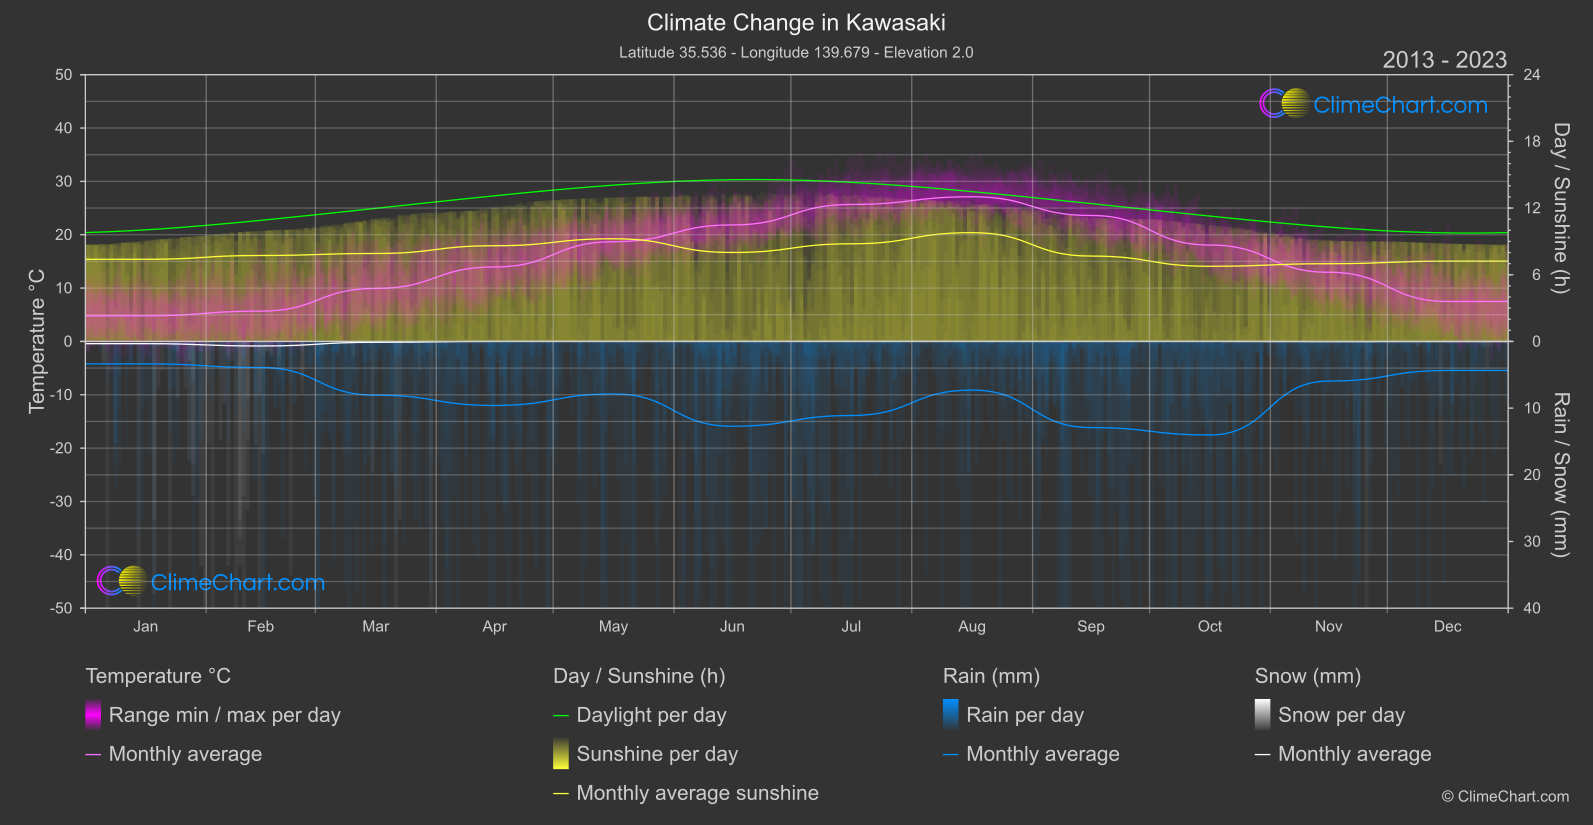
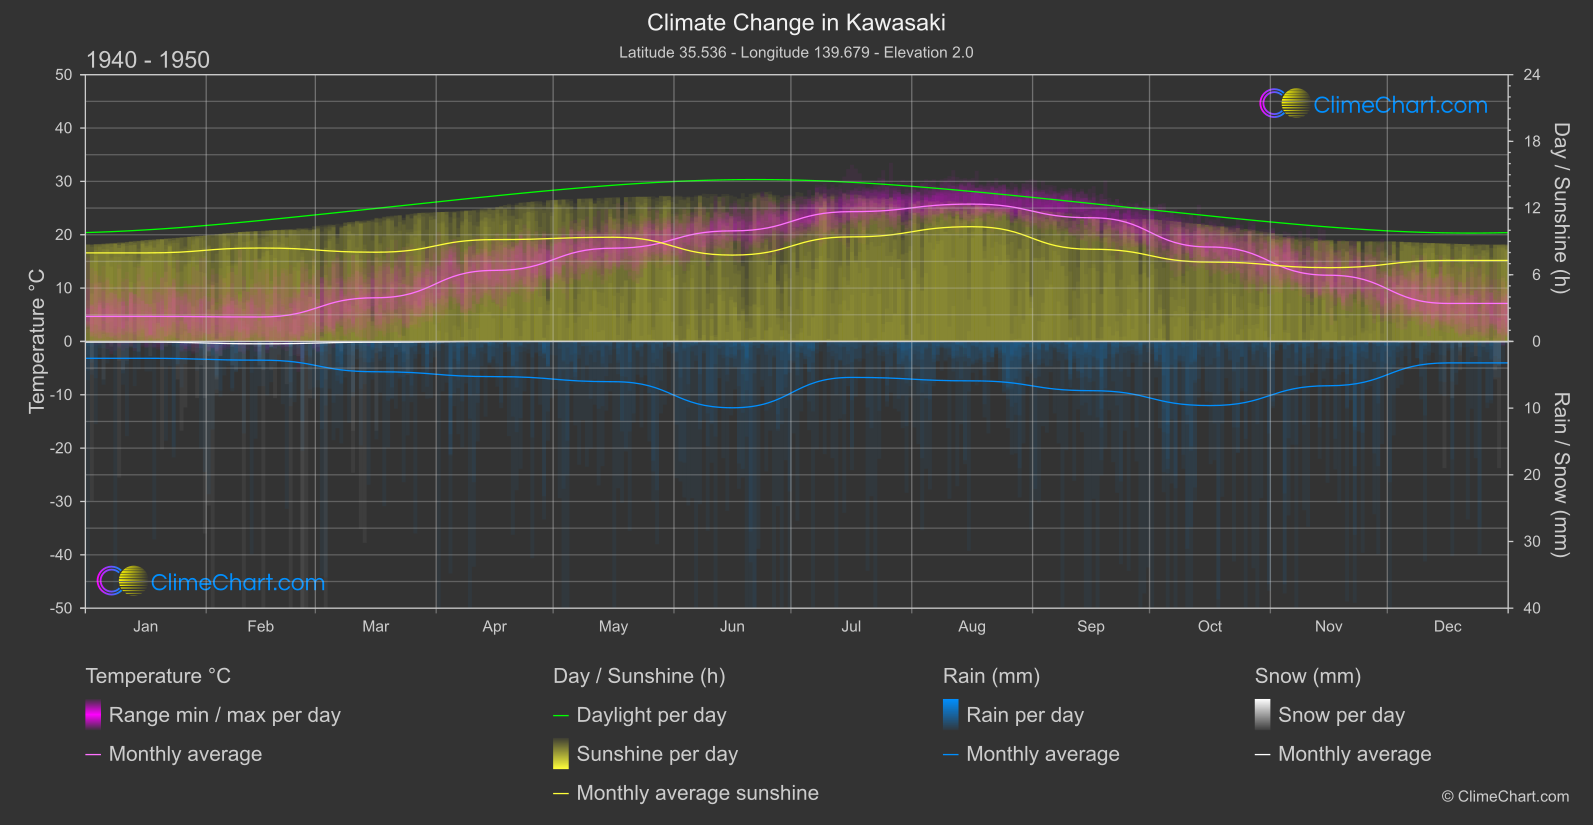
Kawasaki, Japan has experienced noticeable changes in climate over the years. From 1940 to 1950 compared to 2013 to 2024, the data shows a significant increase in average temperatures across most months. February stands out with a temperature change of 1.094°C, while March records the highest temperature change of 1.751°C. In terms of rainfall, there is a clear trend of higher precipitation levels in recent years, especially in July and September. Understanding these climate shifts is crucial for adapting to a changing environment.
Climate Change Data Overview for Kawasaki, Japan
Explore the comprehensive climate change data for Kawasaki, Japan. This detailed table provides valuable insights into temperature variations, precipitation levels, and seasonal changes influenced by climate change, helping you understand the unique weather patterns of this region.
Temperature °C
| Month | ⌀ 1940 - 1950 | ⌀ 2013 - 2023 | +/- |
|---|---|---|---|
| Jan | 4.69 | 4.80 | 0.11 |
| Feb | 4.59 | 5.68 | 1.09 |
| Mar | 8.19 | 9.94 | 1.75 |
| Apr | 13.32 | 13.97 | 0.65 |
| May | 17.48 | 18.70 | 1.21 |
| Jun | 20.72 | 21.84 | 1.11 |
| Jul | 24.33 | 25.68 | 1.35 |
| Aug | 25.74 | 27.12 | 1.38 |
| Sep | 23.18 | 23.61 | 0.43 |
| Oct | 17.70 | 18.07 | 0.37 |
| Nov | 12.41 | 12.97 | 0.56 |
| Dec | 7.12 | 7.49 | 0.37 |
| ⌀ Month | 14.96 | 15.82 | 0.87 |
Sunshine (h)
| Month | ⌀ 1940 - 1950 | ⌀ 2013 - 2023 | +/- |
|---|---|---|---|
| Jan | 7.97 | 7.39 | -0.58 |
| Feb | 8.40 | 7.73 | -0.67 |
| Mar | 8.03 | 7.91 | -0.12 |
| Apr | 9.16 | 8.61 | -0.55 |
| May | 9.37 | 9.24 | -0.13 |
| Jun | 7.77 | 8.00 | 0.23 |
| Jul | 9.41 | 8.78 | -0.63 |
| Aug | 10.32 | 9.79 | -0.54 |
| Sep | 8.30 | 7.68 | -0.62 |
| Oct | 7.14 | 6.76 | -0.38 |
| Nov | 6.64 | 6.99 | 0.35 |
| Dec | 7.28 | 7.22 | -0.06 |
| ⌀ Month | 8.32 | 8.01 | -0.31 |
Rain (mm)
| Month | ⌀ 1940 - 1950 | ⌀ 2013 - 2023 | +/- |
|---|---|---|---|
| Jan | 1.26 | 1.68 | 0.42 |
| Feb | 1.40 | 1.96 | 0.55 |
| Mar | 2.27 | 4.03 | 1.76 |
| Apr | 2.64 | 4.80 | 2.16 |
| May | 3.02 | 3.94 | 0.92 |
| Jun | 4.97 | 6.36 | 1.38 |
| Jul | 2.70 | 5.55 | 2.86 |
| Aug | 2.96 | 3.65 | 0.69 |
| Sep | 3.69 | 6.46 | 2.77 |
| Oct | 4.81 | 7.01 | 2.20 |
| Nov | 3.32 | 2.97 | -0.35 |
| Dec | 1.61 | 2.18 | 0.57 |
| ⌀ Month | 2.89 | 4.22 | 1.33 |
Snow (mm)
| Month | ⌀ 1940 - 1950 | ⌀ 2013 - 2023 | +/- |
|---|---|---|---|
| Jan | 0.05 | 0.17 | 0.12 |
| Feb | 0.18 | 0.34 | 0.16 |
| Mar | 0.06 | 0.06 | 0.01 |
| Apr | 0.00 | 0.00 | 0.00 |
| May | 0.00 | 0.00 | 0.00 |
| Jun | 0.00 | 0.00 | 0.00 |
| Jul | 0.00 | 0.00 | 0.00 |
| Aug | 0.00 | 0.00 | 0.00 |
| Sep | 0.00 | 0.00 | 0.00 |
| Oct | 0.00 | 0.00 | 0.00 |
| Nov | 0.00 | 0.01 | 0.01 |
| Dec | 0.02 | 0.01 | -0.01 |
| ⌀ Month | 0.03 | 0.05 | 0.02 |