Climate Change Chart of Karachi, Pakistan
Comprehensive Climate Change Chart of Karachi, Pakistan: Monthly Averages and Impact Trends
Exploring the changing climate patterns in Karachi, Pakistan reveals interesting insights about temperature, rainfall, and sunshine duration over the years.
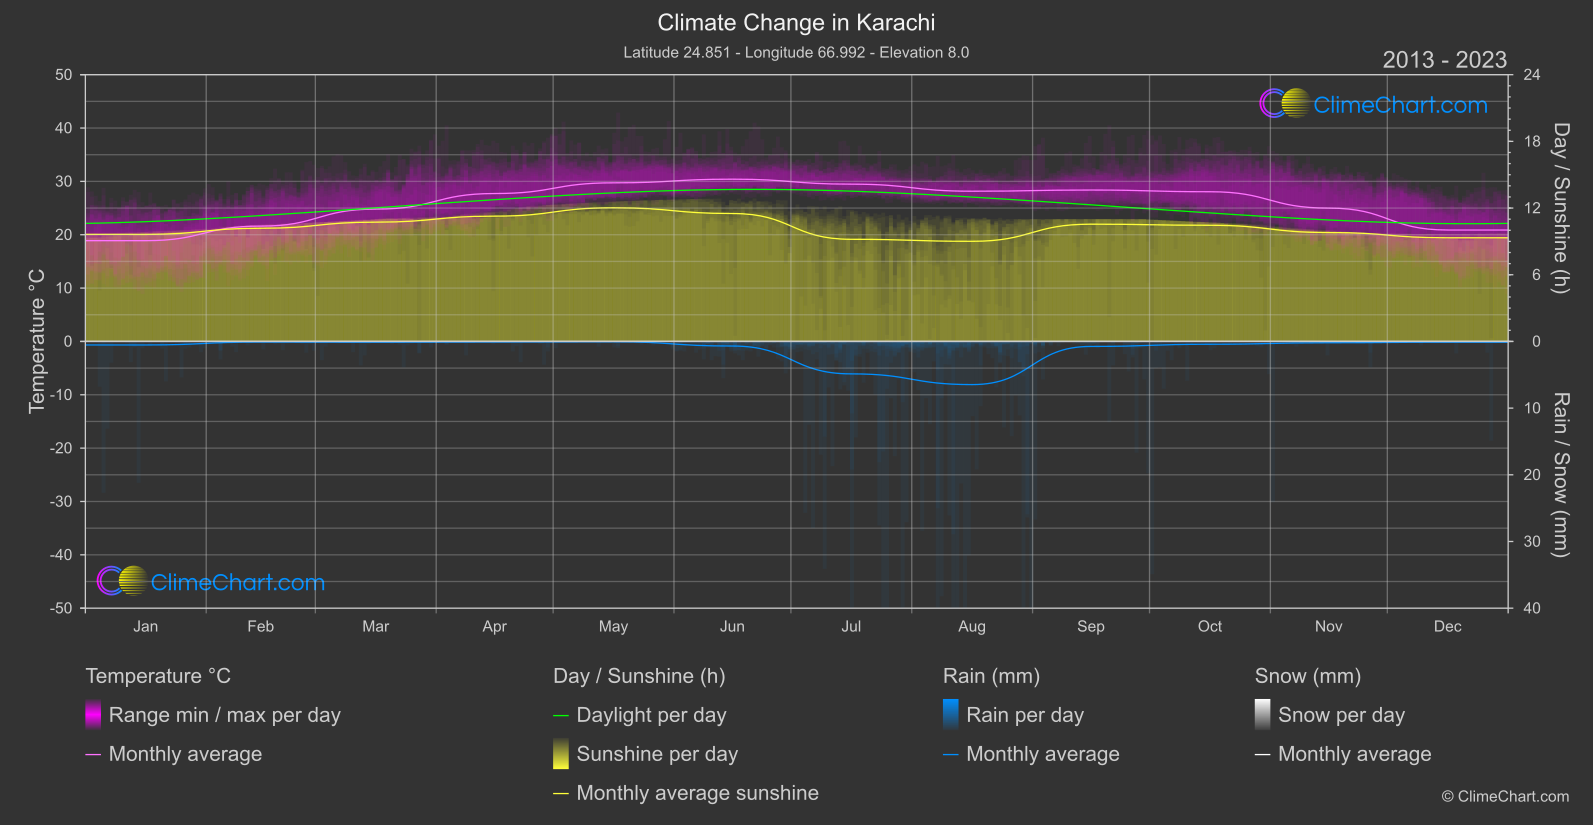
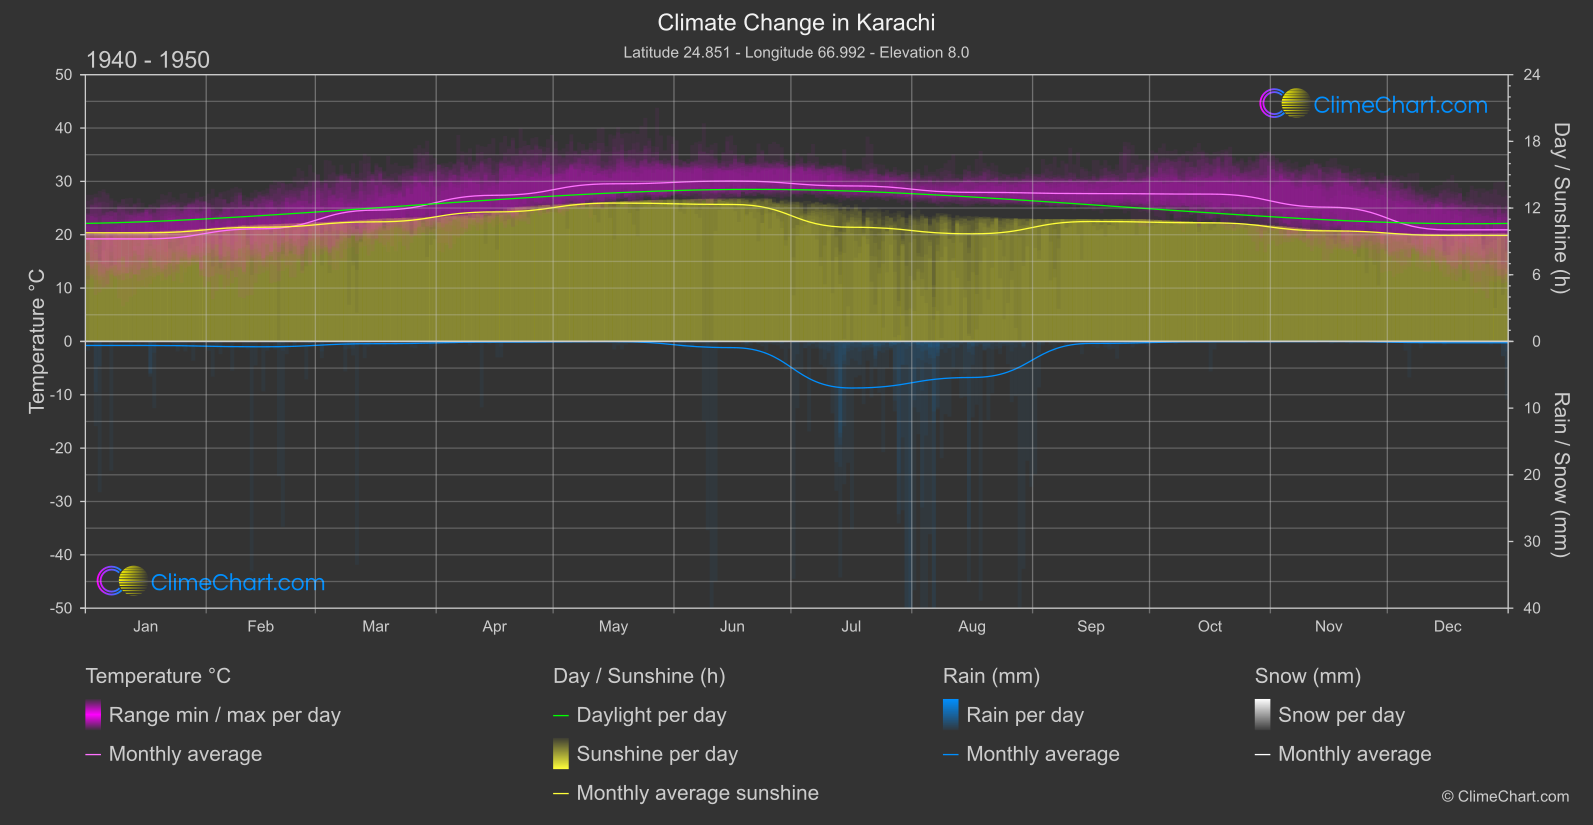
Karachi, the largest city in Pakistan, has experienced noticeable changes in climate over the decades. Analyzing the temperature data, it can be observed that September has shown the highest temperature increase with a change of 0.67°C from 1940-1950 to 2013-2024. In terms of rainfall, July witnessed the most significant decrease, with a change of -1.06 mm in rainfall from the two time periods. The duration of sunshine also exhibited variations, with June displaying the largest decrease in sunshine hours by 0.81 hours. These changes highlight the impact of climate change on Karachi's weather patterns.
Climate Change Data Overview for Karachi, Pakistan
Explore the comprehensive climate change data for Karachi, Pakistan. This detailed table provides valuable insights into temperature variations, precipitation levels, and seasonal changes influenced by climate change, helping you understand the unique weather patterns of this region.
Temperature °C
| Month | ⌀ 1940 - 1950 | ⌀ 2013 - 2023 | +/- |
|---|---|---|---|
| Jan | 19.23 | 18.89 | -0.34 |
| Feb | 21.12 | 21.62 | 0.50 |
| Mar | 24.61 | 24.80 | 0.19 |
| Apr | 27.39 | 27.72 | 0.33 |
| May | 29.55 | 29.73 | 0.18 |
| Jun | 30.07 | 30.41 | 0.35 |
| Jul | 29.15 | 29.48 | 0.33 |
| Aug | 27.94 | 28.16 | 0.21 |
| Sep | 27.71 | 28.38 | 0.67 |
| Oct | 27.62 | 28.06 | 0.44 |
| Nov | 25.16 | 24.99 | -0.17 |
| Dec | 20.92 | 20.88 | -0.04 |
| ⌀ Month | 25.87 | 26.09 | 0.22 |
Sunshine (h)
| Month | ⌀ 1940 - 1950 | ⌀ 2013 - 2023 | +/- |
|---|---|---|---|
| Jan | 9.78 | 9.63 | -0.14 |
| Feb | 10.27 | 10.18 | -0.09 |
| Mar | 10.76 | 10.73 | -0.03 |
| Apr | 11.65 | 11.27 | -0.38 |
| May | 12.45 | 12.02 | -0.43 |
| Jun | 12.32 | 11.51 | -0.81 |
| Jul | 10.27 | 9.19 | -1.08 |
| Aug | 9.68 | 9.01 | -0.67 |
| Sep | 10.79 | 10.55 | -0.24 |
| Oct | 10.67 | 10.45 | -0.22 |
| Nov | 9.95 | 9.80 | -0.15 |
| Dec | 9.54 | 9.33 | -0.21 |
| ⌀ Month | 10.68 | 10.31 | -0.37 |
Rain (mm)
| Month | ⌀ 1940 - 1950 | ⌀ 2013 - 2023 | +/- |
|---|---|---|---|
| Jan | 0.30 | 0.26 | -0.04 |
| Feb | 0.40 | 0.05 | -0.35 |
| Mar | 0.17 | 0.06 | -0.11 |
| Apr | 0.05 | 0.04 | -0.01 |
| May | 0.01 | 0.03 | 0.01 |
| Jun | 0.46 | 0.34 | -0.12 |
| Jul | 3.49 | 2.43 | -1.06 |
| Aug | 2.70 | 3.24 | 0.53 |
| Sep | 0.15 | 0.37 | 0.23 |
| Oct | 0.02 | 0.21 | 0.19 |
| Nov | 0.00 | 0.10 | 0.09 |
| Dec | 0.10 | 0.06 | -0.04 |
| ⌀ Month | 0.66 | 0.60 | -0.06 |
Snow (mm)
| Month | ⌀ 1940 - 1950 | ⌀ 2013 - 2023 | +/- |
|---|---|---|---|
| Jan | 0.00 | 0.00 | 0.00 |
| Feb | 0.00 | 0.00 | 0.00 |
| Mar | 0.00 | 0.00 | 0.00 |
| Apr | 0.00 | 0.00 | 0.00 |
| May | 0.00 | 0.00 | 0.00 |
| Jun | 0.00 | 0.00 | 0.00 |
| Jul | 0.00 | 0.00 | 0.00 |
| Aug | 0.00 | 0.00 | 0.00 |
| Sep | 0.00 | 0.00 | 0.00 |
| Oct | 0.00 | 0.00 | 0.00 |
| Nov | 0.00 | 0.00 | 0.00 |
| Dec | 0.00 | 0.00 | 0.00 |
| ⌀ Month | 0.00 | 0.00 | 0.00 |