Climate Change Chart of Kanchanaburi, Thailand
Comprehensive Climate Change Chart of Kanchanaburi, Thailand: Monthly Averages and Impact Trends
Exploring the changing climate in Kanchanaburi, Thailand reveals significant shifts in temperature, rainfall, and sunshine duration over the years. Let's dive into the data to understand the impact of climate change on this region.
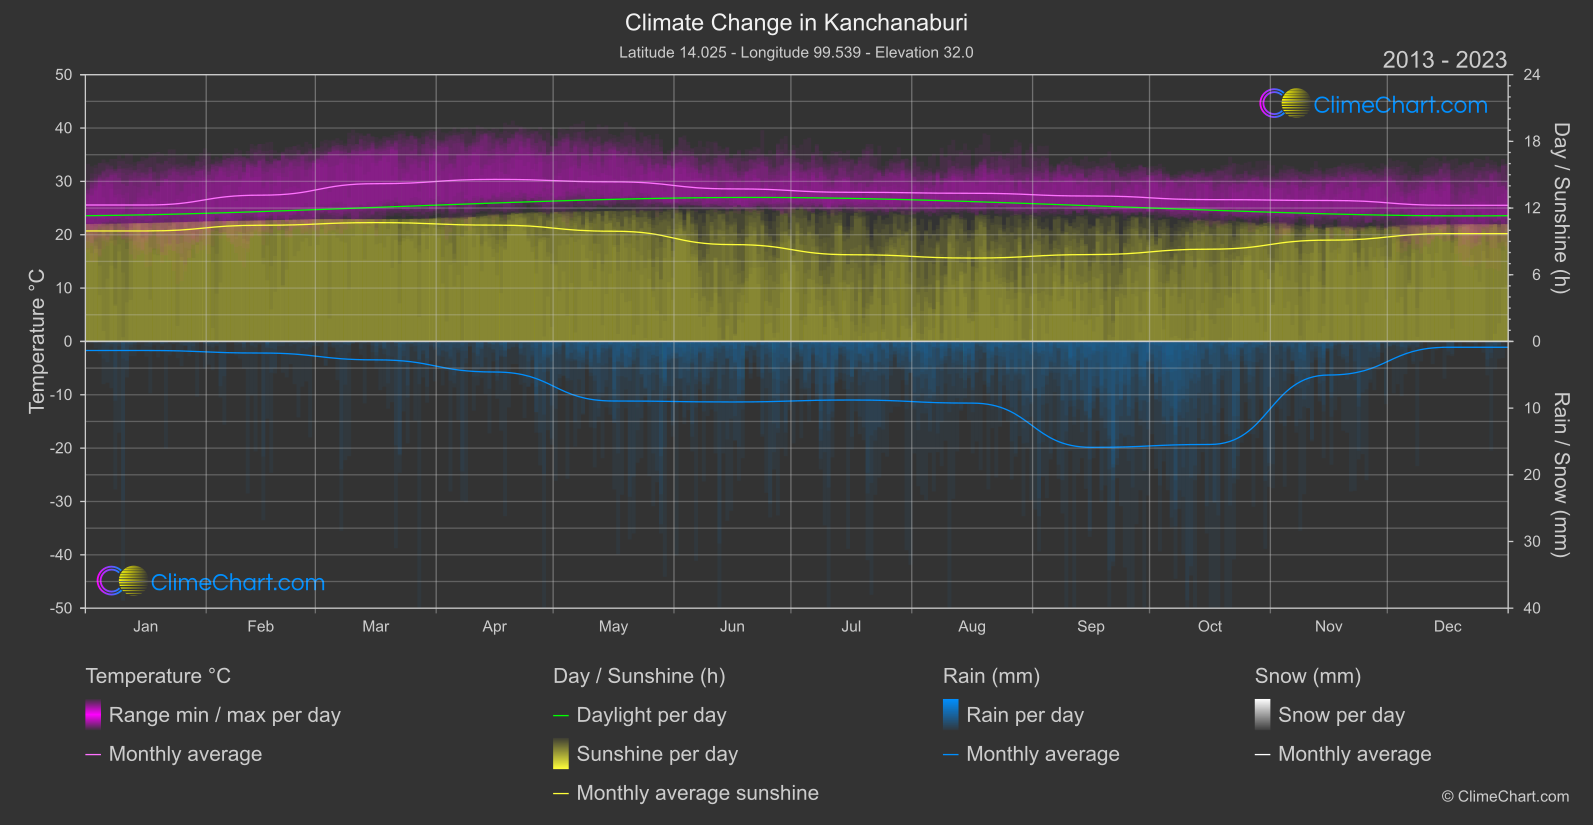
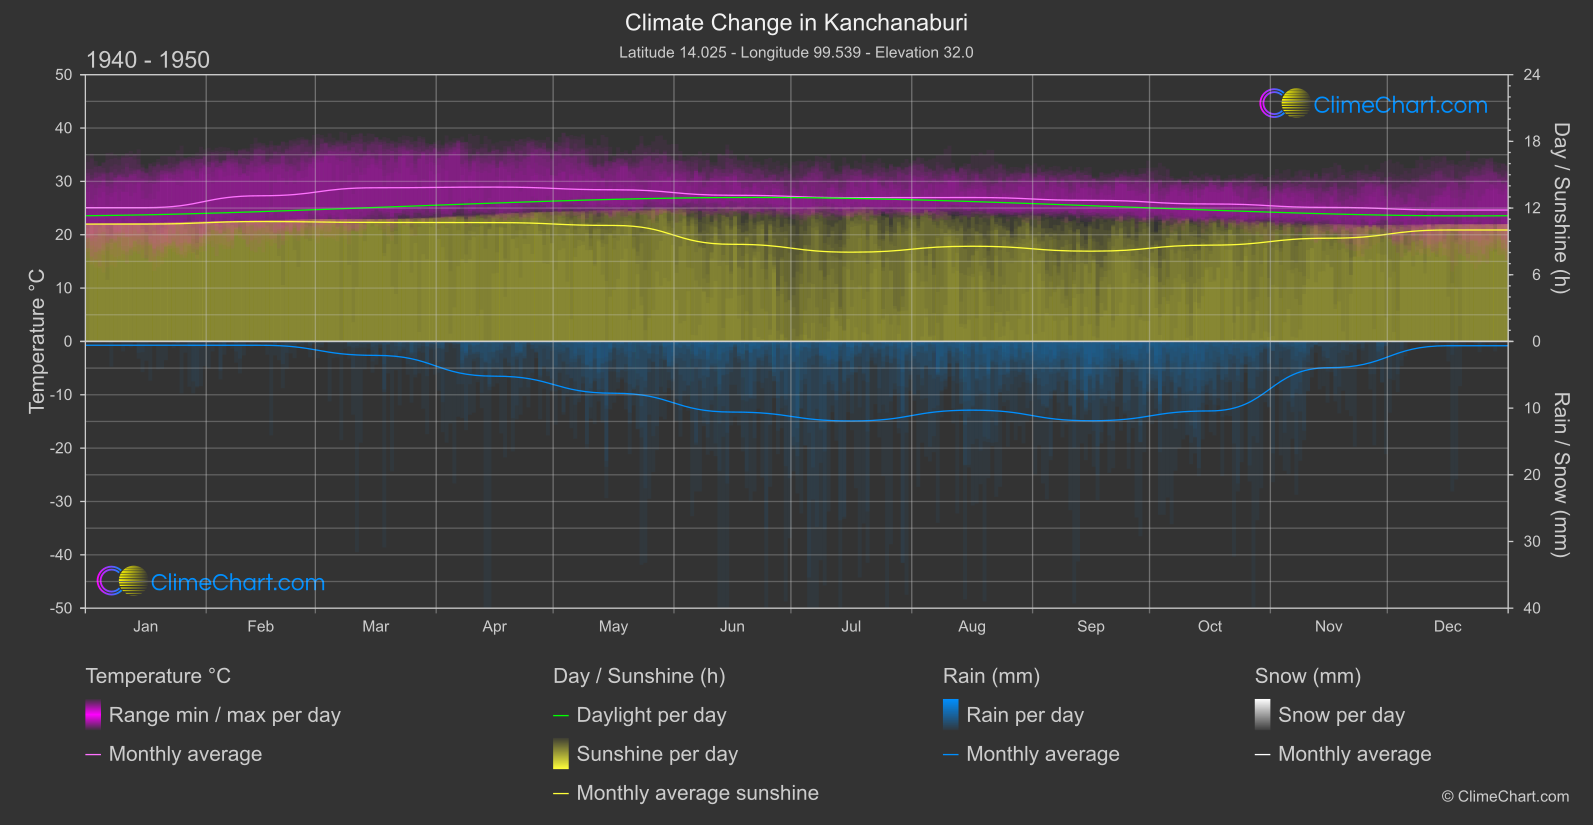
Kanchanaburi, Thailand, has experienced notable changes in its climate patterns. Analyzing the data from 1940 to 1950 compared to 2013 to 2024, we observe a clear trend of increasing temperatures across most months. The month with the highest temperature change is April, with a significant rise of 1.44°C. In terms of rainfall, there are fluctuations in the amount of precipitation, with September and October showing the most substantial increases. Sunshine duration has decreased in several months, notably in August, where there is a decline of 1.06 hours. These findings highlight the impact of climate change on Kanchanaburi's weather conditions.
Climate Change Data Overview for Kanchanaburi, Thailand
Explore the comprehensive climate change data for Kanchanaburi, Thailand. This detailed table provides valuable insights into temperature variations, precipitation levels, and seasonal changes influenced by climate change, helping you understand the unique weather patterns of this region.
Temperature °C
| Month | ⌀ 1940 - 1950 | ⌀ 2013 - 2023 | +/- |
|---|---|---|---|
| Jan | 25.07 | 25.57 | 0.50 |
| Feb | 27.30 | 27.42 | 0.11 |
| Mar | 28.81 | 29.57 | 0.76 |
| Apr | 28.93 | 30.37 | 1.44 |
| May | 28.43 | 29.91 | 1.48 |
| Jun | 27.40 | 28.59 | 1.20 |
| Jul | 26.95 | 27.95 | 1.00 |
| Aug | 26.98 | 27.77 | 0.79 |
| Sep | 26.44 | 27.26 | 0.82 |
| Oct | 25.76 | 26.58 | 0.82 |
| Nov | 25.12 | 26.42 | 1.30 |
| Dec | 24.63 | 25.52 | 0.89 |
| ⌀ Month | 26.82 | 27.74 | 0.93 |
Sunshine (h)
| Month | ⌀ 1940 - 1950 | ⌀ 2013 - 2023 | +/- |
|---|---|---|---|
| Jan | 10.56 | 9.94 | -0.62 |
| Feb | 10.79 | 10.45 | -0.33 |
| Mar | 10.71 | 10.69 | -0.02 |
| Apr | 10.69 | 10.46 | -0.23 |
| May | 10.44 | 9.92 | -0.52 |
| Jun | 8.74 | 8.71 | -0.03 |
| Jul | 8.03 | 7.80 | -0.23 |
| Aug | 8.56 | 7.50 | -1.06 |
| Sep | 8.12 | 7.82 | -0.31 |
| Oct | 8.66 | 8.30 | -0.36 |
| Nov | 9.29 | 9.11 | -0.17 |
| Dec | 10.03 | 9.70 | -0.33 |
| ⌀ Month | 9.55 | 9.20 | -0.35 |
Rain (mm)
| Month | ⌀ 1940 - 1950 | ⌀ 2013 - 2023 | +/- |
|---|---|---|---|
| Jan | 0.28 | 0.68 | 0.39 |
| Feb | 0.29 | 0.87 | 0.58 |
| Mar | 1.05 | 1.38 | 0.33 |
| Apr | 2.60 | 2.29 | -0.31 |
| May | 3.88 | 4.47 | 0.58 |
| Jun | 5.30 | 4.54 | -0.76 |
| Jul | 5.96 | 4.39 | -1.57 |
| Aug | 5.15 | 4.62 | -0.53 |
| Sep | 5.95 | 7.94 | 1.99 |
| Oct | 5.21 | 7.72 | 2.51 |
| Nov | 1.97 | 2.52 | 0.55 |
| Dec | 0.32 | 0.44 | 0.11 |
| ⌀ Month | 3.16 | 3.49 | 0.32 |
Snow (mm)
| Month | ⌀ 1940 - 1950 | ⌀ 2013 - 2023 | +/- |
|---|---|---|---|
| Jan | 0.00 | 0.00 | 0.00 |
| Feb | 0.00 | 0.00 | 0.00 |
| Mar | 0.00 | 0.00 | 0.00 |
| Apr | 0.00 | 0.00 | 0.00 |
| May | 0.00 | 0.00 | 0.00 |
| Jun | 0.00 | 0.00 | 0.00 |
| Jul | 0.00 | 0.00 | 0.00 |
| Aug | 0.00 | 0.00 | 0.00 |
| Sep | 0.00 | 0.00 | 0.00 |
| Oct | 0.00 | 0.00 | 0.00 |
| Nov | 0.00 | 0.00 | 0.00 |
| Dec | 0.00 | 0.00 | 0.00 |
| ⌀ Month | 0.00 | 0.00 | 0.00 |