Climate Change Chart of Juneau, USA
Comprehensive Climate Change Chart of Juneau, USA: Monthly Averages and Impact Trends
Exploring the changing climate in Juneau, USA reveals intriguing patterns and trends. Dive into the data to uncover insights about temperature, rainfall, snowfall, and sunshine duration.
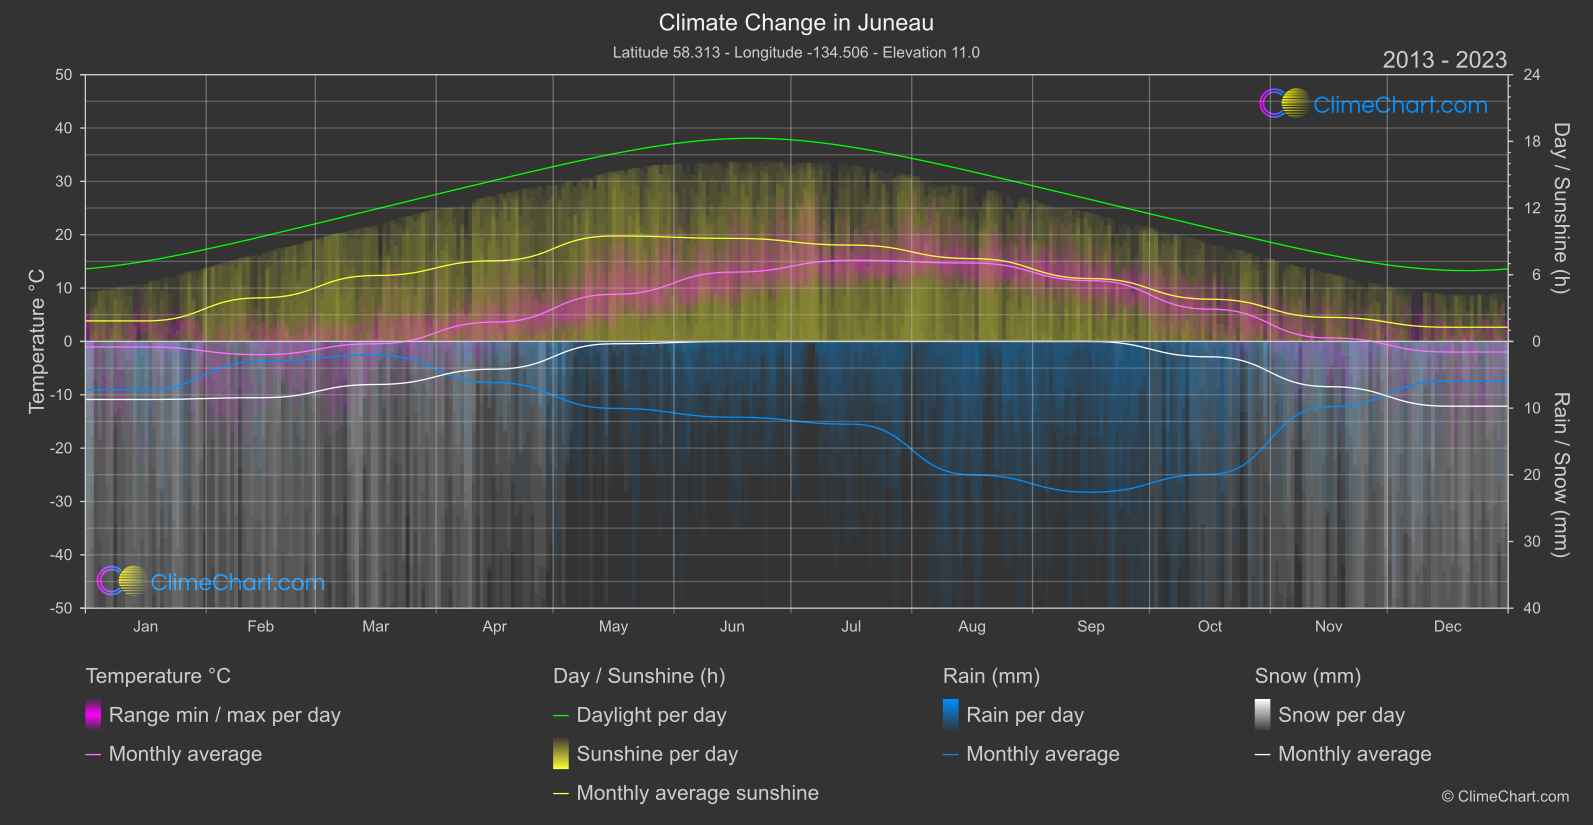
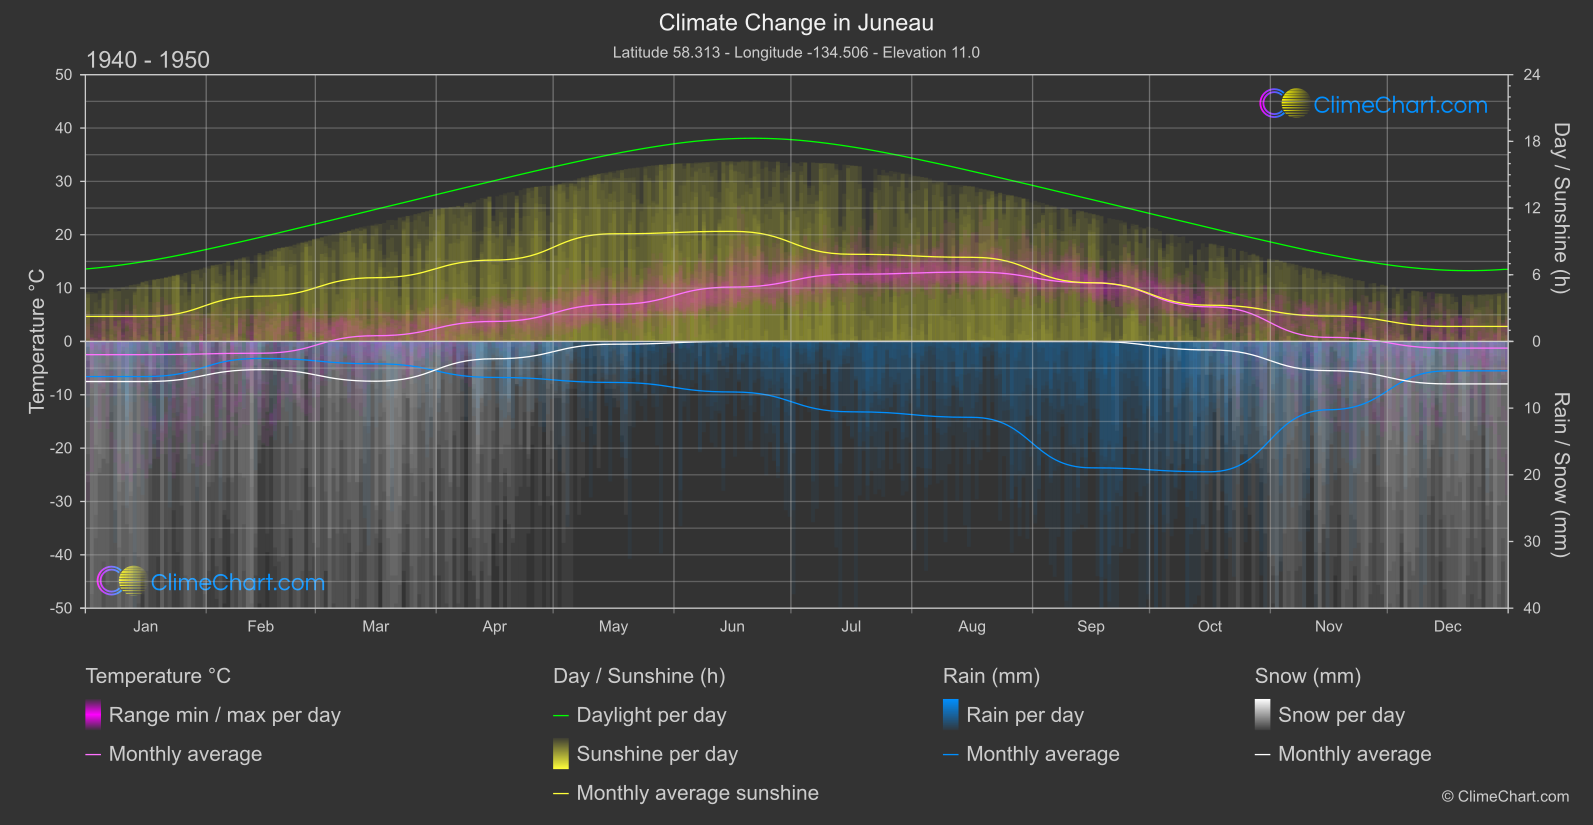
Juneau, USA experiences notable changes in temperature, with June showing the highest increase over the years. Rainfall also exhibits significant variations, with August having the largest increase in precipitation. Snowfall and sunshine duration have their own unique trends, showcasing the evolving climate patterns in Juneau.
Climate Change Data Overview for Juneau, USA
Explore the comprehensive climate change data for Juneau, USA. This detailed table provides valuable insights into temperature variations, precipitation levels, and seasonal changes influenced by climate change, helping you understand the unique weather patterns of this region.
Temperature °C
| Month | ⌀ 1940 - 1950 | ⌀ 2013 - 2023 | +/- |
|---|---|---|---|
| Jan | -2.48 | -1.04 | 1.44 |
| Feb | -2.21 | -2.48 | -0.27 |
| Mar | 1.07 | -0.43 | -1.50 |
| Apr | 3.75 | 3.63 | -0.12 |
| May | 6.93 | 8.82 | 1.88 |
| Jun | 10.18 | 12.99 | 2.81 |
| Jul | 12.60 | 15.21 | 2.61 |
| Aug | 13.00 | 14.70 | 1.69 |
| Sep | 11.00 | 11.39 | 0.39 |
| Oct | 6.48 | 6.06 | -0.42 |
| Nov | 0.76 | 0.66 | -0.10 |
| Dec | -1.25 | -1.98 | -0.73 |
| ⌀ Month | 4.99 | 5.63 | 0.64 |
Sunshine (h)
| Month | ⌀ 1940 - 1950 | ⌀ 2013 - 2023 | +/- |
|---|---|---|---|
| Jan | 2.25 | 1.84 | -0.41 |
| Feb | 4.07 | 3.93 | -0.15 |
| Mar | 5.74 | 5.93 | 0.20 |
| Apr | 7.32 | 7.26 | -0.06 |
| May | 9.68 | 9.49 | -0.19 |
| Jun | 9.90 | 9.27 | -0.63 |
| Jul | 7.84 | 8.67 | 0.83 |
| Aug | 7.57 | 7.45 | -0.11 |
| Sep | 5.28 | 5.66 | 0.37 |
| Oct | 3.26 | 3.80 | 0.54 |
| Nov | 2.29 | 2.16 | -0.12 |
| Dec | 1.35 | 1.28 | -0.07 |
| ⌀ Month | 5.55 | 5.56 | 0.02 |
Rain (mm)
| Month | ⌀ 1940 - 1950 | ⌀ 2013 - 2023 | +/- |
|---|---|---|---|
| Jan | 2.63 | 3.61 | 0.97 |
| Feb | 1.27 | 1.50 | 0.23 |
| Mar | 1.68 | 1.02 | -0.65 |
| Apr | 2.70 | 3.09 | 0.39 |
| May | 3.07 | 5.02 | 1.95 |
| Jun | 3.79 | 5.68 | 1.89 |
| Jul | 5.28 | 6.20 | 0.93 |
| Aug | 5.69 | 10.01 | 4.31 |
| Sep | 9.48 | 11.31 | 1.83 |
| Oct | 9.77 | 9.96 | 0.19 |
| Nov | 5.12 | 4.90 | -0.22 |
| Dec | 2.21 | 2.95 | 0.75 |
| ⌀ Month | 4.39 | 5.44 | 1.05 |
Snow (mm)
| Month | ⌀ 1940 - 1950 | ⌀ 2013 - 2023 | +/- |
|---|---|---|---|
| Jan | 3.01 | 4.35 | 1.35 |
| Feb | 2.12 | 4.22 | 2.10 |
| Mar | 2.98 | 3.23 | 0.25 |
| Apr | 1.30 | 2.07 | 0.77 |
| May | 0.21 | 0.17 | -0.03 |
| Jun | 0.00 | 0.00 | -0.00 |
| Jul | 0.00 | 0.00 | 0.00 |
| Aug | 0.00 | 0.00 | 0.00 |
| Sep | 0.00 | 0.00 | -0.00 |
| Oct | 0.64 | 1.16 | 0.52 |
| Nov | 2.19 | 3.39 | 1.20 |
| Dec | 3.18 | 4.86 | 1.67 |
| ⌀ Month | 1.30 | 1.95 | 0.65 |