Climate Change Chart of Juneau, Alaska, USA
Comprehensive Climate Change Chart of Juneau, Alaska, USA: Monthly Averages and Impact Trends
Exploring the changing climate in Juneau, Alaska, USA reveals significant shifts in temperature, rainfall, snowfall, and sunshine duration over the years. Let's delve into the data to understand the impact of climate change on this region.
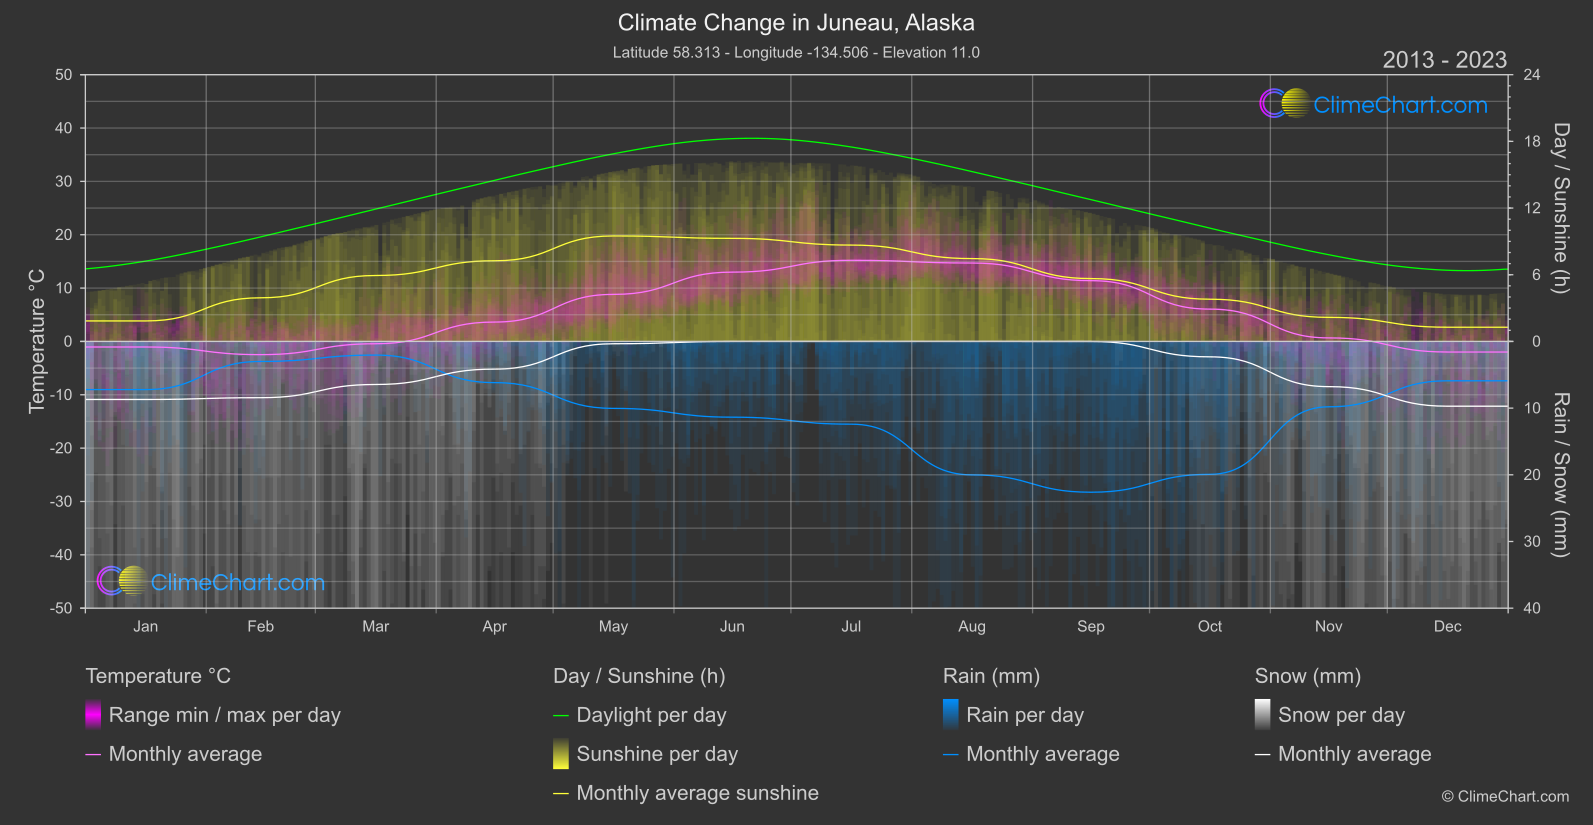
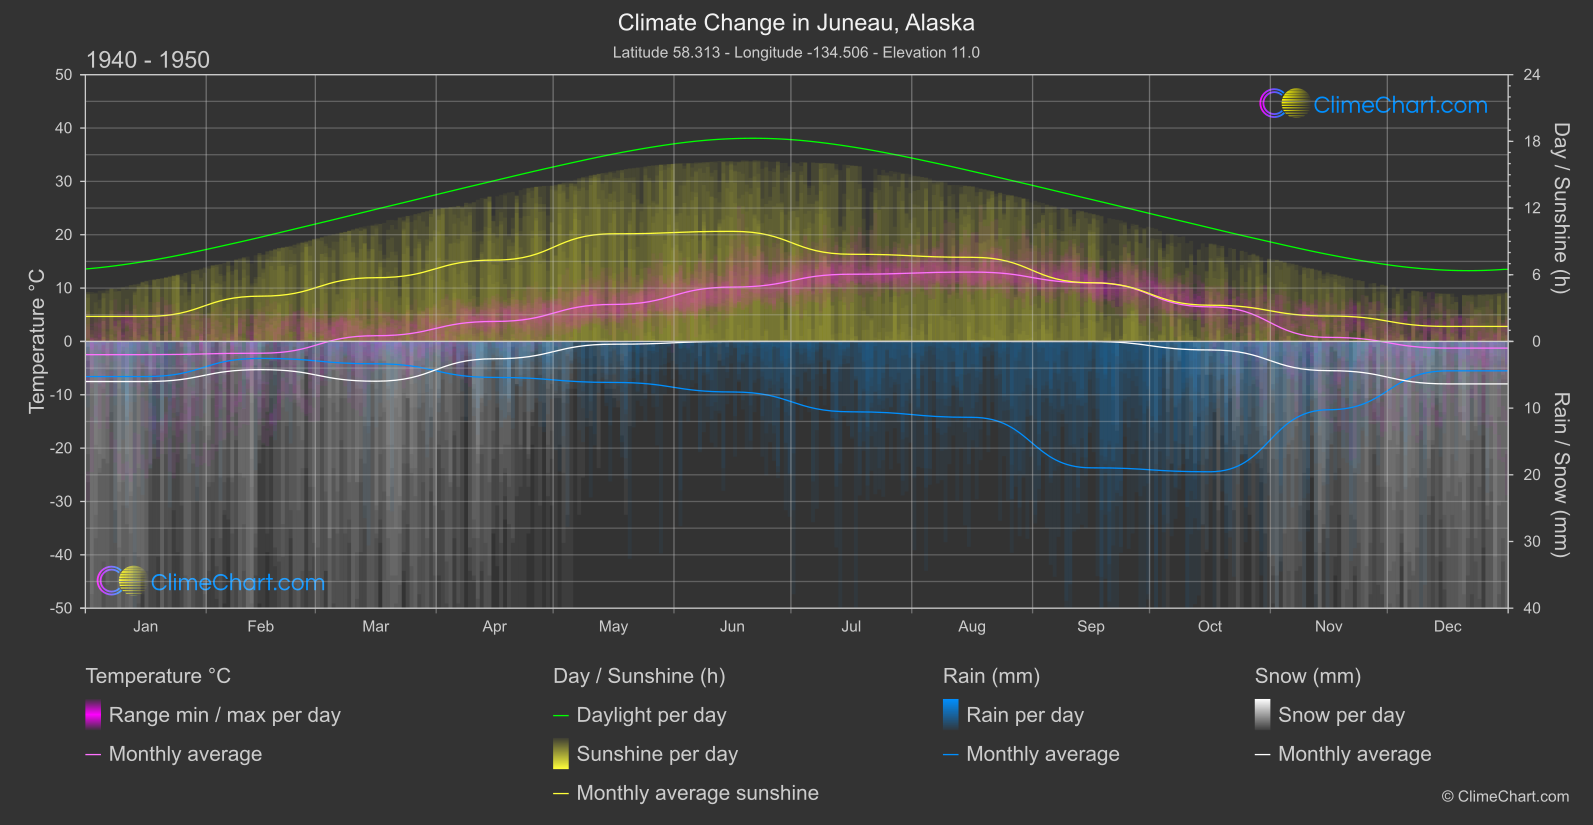
Juneau, the capital city of Alaska, experiences varying climate patterns, with notable changes in temperature, rainfall, snowfall, and sunshine duration. Analyzing the data from 1940 to 1950 compared to 2013 to 2024, we observe that June and July have shown the highest increase in temperatures, with June experiencing a significant rise of 2.81°C. In terms of rainfall, August witnessed the largest change, with an increase of 4.31 mm. Snowfall has decreased overall, with May and June showing the most substantial reductions. Additionally, sunshine duration has fluctuated, with July seeing a notable rise of 0.83 hours.
Climate Change Data Overview for Juneau, Alaska, USA
Explore the comprehensive climate change data for Juneau, Alaska, USA. This detailed table provides valuable insights into temperature variations, precipitation levels, and seasonal changes influenced by climate change, helping you understand the unique weather patterns of this region.
Temperature °C
| Month | ⌀ 1940 - 1950 | ⌀ 2013 - 2023 | +/- |
|---|---|---|---|
| Jan | -2.48 | -1.04 | 1.44 |
| Feb | -2.21 | -2.48 | -0.27 |
| Mar | 1.07 | -0.43 | -1.50 |
| Apr | 3.75 | 3.63 | -0.12 |
| May | 6.93 | 8.82 | 1.88 |
| Jun | 10.18 | 12.99 | 2.81 |
| Jul | 12.60 | 15.21 | 2.61 |
| Aug | 13.00 | 14.70 | 1.69 |
| Sep | 11.00 | 11.39 | 0.39 |
| Oct | 6.48 | 6.06 | -0.42 |
| Nov | 0.76 | 0.66 | -0.10 |
| Dec | -1.25 | -1.98 | -0.73 |
| ⌀ Month | 4.99 | 5.63 | 0.64 |
Sunshine (h)
| Month | ⌀ 1940 - 1950 | ⌀ 2013 - 2023 | +/- |
|---|---|---|---|
| Jan | 2.25 | 1.84 | -0.41 |
| Feb | 4.07 | 3.93 | -0.15 |
| Mar | 5.74 | 5.93 | 0.20 |
| Apr | 7.32 | 7.26 | -0.06 |
| May | 9.68 | 9.49 | -0.19 |
| Jun | 9.90 | 9.27 | -0.63 |
| Jul | 7.84 | 8.67 | 0.83 |
| Aug | 7.57 | 7.45 | -0.11 |
| Sep | 5.28 | 5.66 | 0.37 |
| Oct | 3.26 | 3.80 | 0.54 |
| Nov | 2.29 | 2.16 | -0.12 |
| Dec | 1.35 | 1.28 | -0.07 |
| ⌀ Month | 5.55 | 5.56 | 0.02 |
Rain (mm)
| Month | ⌀ 1940 - 1950 | ⌀ 2013 - 2023 | +/- |
|---|---|---|---|
| Jan | 2.63 | 3.61 | 0.97 |
| Feb | 1.27 | 1.50 | 0.23 |
| Mar | 1.68 | 1.02 | -0.65 |
| Apr | 2.70 | 3.09 | 0.39 |
| May | 3.07 | 5.02 | 1.95 |
| Jun | 3.79 | 5.68 | 1.89 |
| Jul | 5.28 | 6.20 | 0.93 |
| Aug | 5.69 | 10.01 | 4.31 |
| Sep | 9.48 | 11.31 | 1.83 |
| Oct | 9.77 | 9.96 | 0.19 |
| Nov | 5.12 | 4.90 | -0.22 |
| Dec | 2.21 | 2.95 | 0.75 |
| ⌀ Month | 4.39 | 5.44 | 1.05 |
Snow (mm)
| Month | ⌀ 1940 - 1950 | ⌀ 2013 - 2023 | +/- |
|---|---|---|---|
| Jan | 3.01 | 4.35 | 1.35 |
| Feb | 2.12 | 4.22 | 2.10 |
| Mar | 2.98 | 3.23 | 0.25 |
| Apr | 1.30 | 2.07 | 0.77 |
| May | 0.21 | 0.17 | -0.03 |
| Jun | 0.00 | 0.00 | -0.00 |
| Jul | 0.00 | 0.00 | 0.00 |
| Aug | 0.00 | 0.00 | 0.00 |
| Sep | 0.00 | 0.00 | -0.00 |
| Oct | 0.64 | 1.16 | 0.52 |
| Nov | 2.19 | 3.39 | 1.20 |
| Dec | 3.18 | 4.86 | 1.67 |
| ⌀ Month | 1.30 | 1.95 | 0.65 |