Climate Change Chart of Jackson Hole, USA
Comprehensive Climate Change Chart of Jackson Hole, USA: Monthly Averages and Impact Trends
Exploring the changing climate in Jackson Hole, USA reveals intriguing insights about temperature, rainfall, snowfall, and sunshine duration.
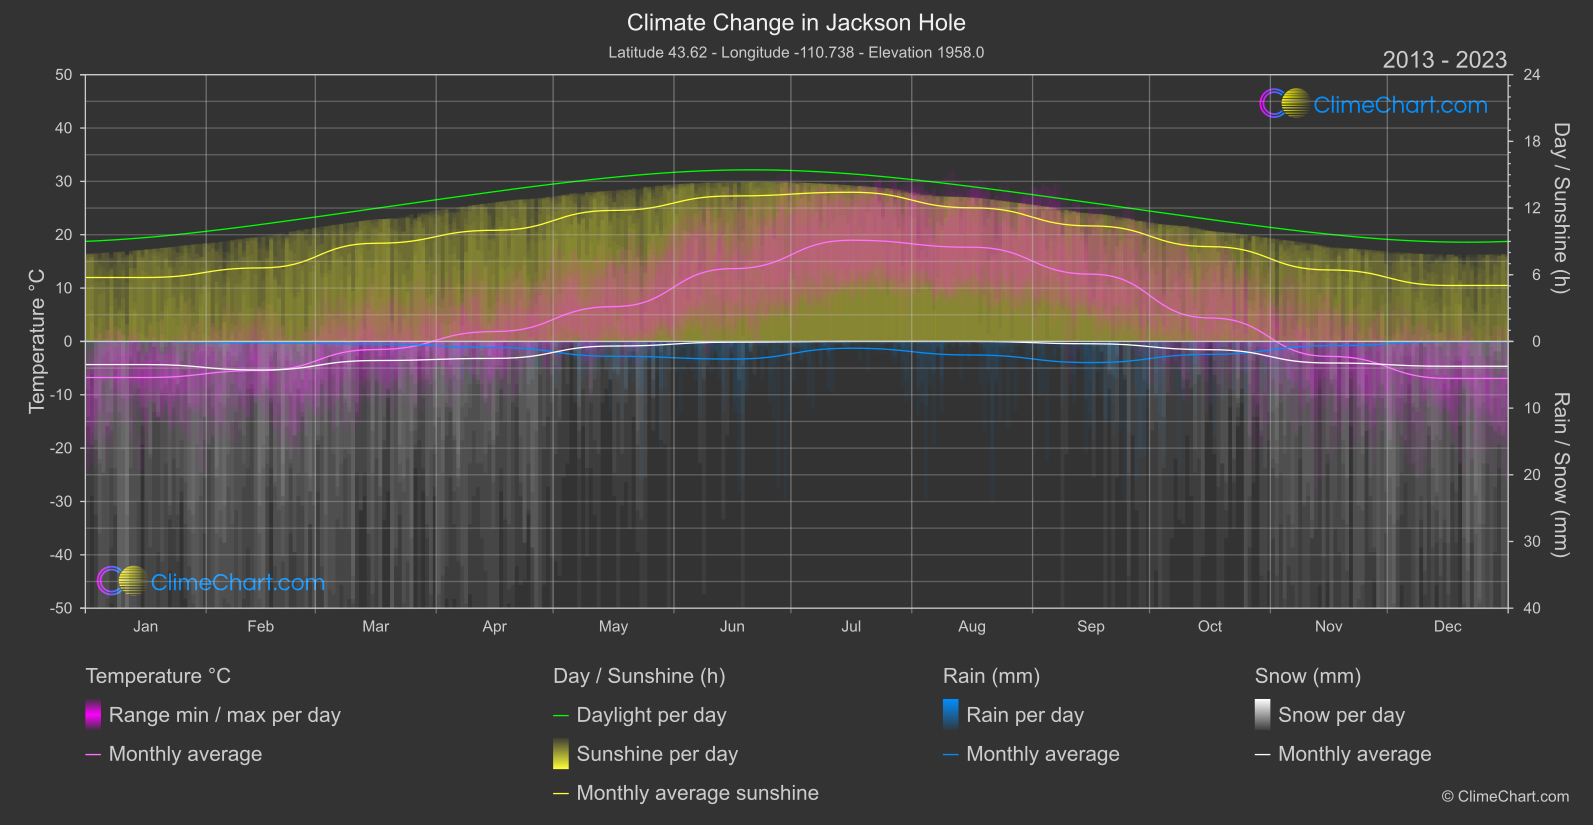
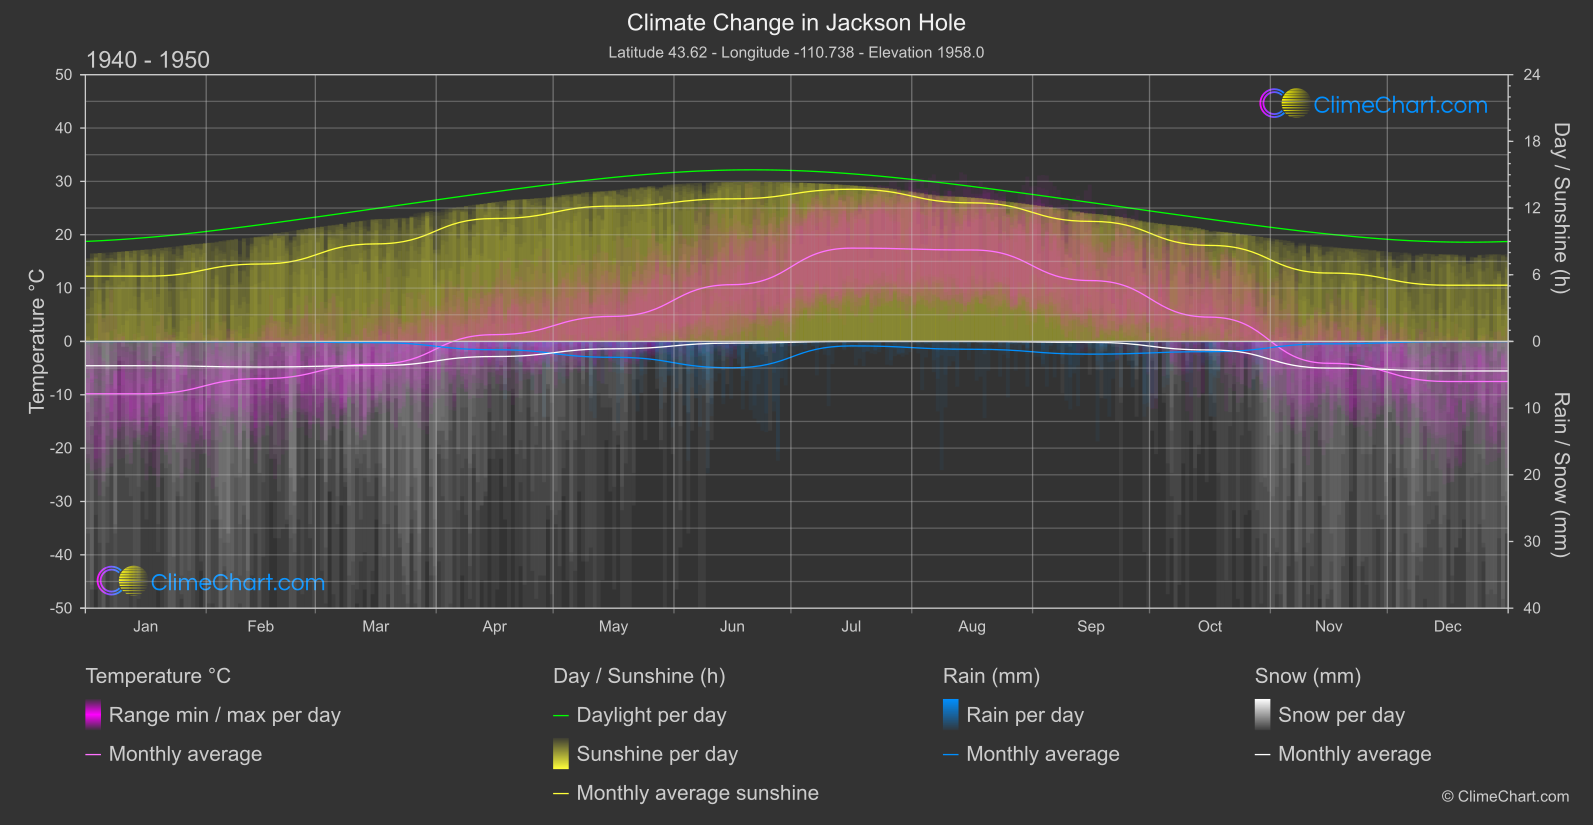
Jackson Hole, located in the USA, has experienced notable changes in climate over the years. Analyzing temperature data from 1940-1950 to 2013-2024, it's evident that the month of June saw a significant increase in temperature by approximately 3°C. In terms of rainfall, the month of September witnessed the highest change with an increase of around 0.63mm. Snowfall patterns also shifted, notably in November where there was a decrease of around 0.39mm. Additionally, the sunshine duration showed minor fluctuations throughout the months, with the most significant change occurring in April, witnessing a decline of approximately 1.06 hours of sunshine.
Climate Change Data Overview for Jackson Hole, USA
Explore the comprehensive climate change data for Jackson Hole, USA. This detailed table provides valuable insights into temperature variations, precipitation levels, and seasonal changes influenced by climate change, helping you understand the unique weather patterns of this region.
Temperature °C
| Month | ⌀ 1940 - 1950 | ⌀ 2013 - 2023 | +/- |
|---|---|---|---|
| Jan | -9.82 | -6.76 | 3.05 |
| Feb | -6.97 | -5.45 | 1.52 |
| Mar | -4.23 | -1.51 | 2.72 |
| Apr | 1.27 | 1.86 | 0.59 |
| May | 4.70 | 6.53 | 1.83 |
| Jun | 10.64 | 13.65 | 3.00 |
| Jul | 17.49 | 18.96 | 1.47 |
| Aug | 17.14 | 17.65 | 0.51 |
| Sep | 11.40 | 12.61 | 1.21 |
| Oct | 4.56 | 4.40 | -0.15 |
| Nov | -4.10 | -2.80 | 1.30 |
| Dec | -7.51 | -6.93 | 0.58 |
| ⌀ Month | 2.88 | 4.35 | 1.47 |
Sunshine (h)
| Month | ⌀ 1940 - 1950 | ⌀ 2013 - 2023 | +/- |
|---|---|---|---|
| Jan | 5.87 | 5.75 | -0.12 |
| Feb | 6.96 | 6.62 | -0.35 |
| Mar | 8.78 | 8.83 | 0.06 |
| Apr | 11.06 | 10.00 | -1.06 |
| May | 12.18 | 11.79 | -0.39 |
| Jun | 12.83 | 13.09 | 0.26 |
| Jul | 13.69 | 13.42 | -0.27 |
| Aug | 12.47 | 12.02 | -0.45 |
| Sep | 10.80 | 10.39 | -0.41 |
| Oct | 8.64 | 8.53 | -0.11 |
| Nov | 6.15 | 6.43 | 0.28 |
| Dec | 5.06 | 5.03 | -0.02 |
| ⌀ Month | 9.54 | 9.33 | -0.22 |
Rain (mm)
| Month | ⌀ 1940 - 1950 | ⌀ 2013 - 2023 | +/- |
|---|---|---|---|
| Jan | 0.00 | 0.01 | 0.01 |
| Feb | 0.02 | 0.10 | 0.08 |
| Mar | 0.09 | 0.20 | 0.10 |
| Apr | 0.62 | 0.46 | -0.17 |
| May | 1.19 | 1.11 | -0.08 |
| Jun | 1.98 | 1.32 | -0.66 |
| Jul | 0.34 | 0.51 | 0.17 |
| Aug | 0.59 | 1.02 | 0.43 |
| Sep | 0.95 | 1.59 | 0.63 |
| Oct | 0.77 | 0.97 | 0.20 |
| Nov | 0.18 | 0.32 | 0.14 |
| Dec | 0.01 | 0.02 | 0.01 |
| ⌀ Month | 0.56 | 0.64 | 0.07 |
Snow (mm)
| Month | ⌀ 1940 - 1950 | ⌀ 2013 - 2023 | +/- |
|---|---|---|---|
| Jan | 1.82 | 1.73 | -0.09 |
| Feb | 1.92 | 2.14 | 0.23 |
| Mar | 1.81 | 1.43 | -0.38 |
| Apr | 1.13 | 1.27 | 0.14 |
| May | 0.55 | 0.35 | -0.21 |
| Jun | 0.13 | 0.06 | -0.07 |
| Jul | 0.00 | 0.00 | 0.00 |
| Aug | 0.00 | 0.00 | 0.00 |
| Sep | 0.07 | 0.17 | 0.10 |
| Oct | 0.64 | 0.62 | -0.02 |
| Nov | 2.00 | 1.62 | -0.39 |
| Dec | 2.22 | 1.86 | -0.35 |
| ⌀ Month | 1.02 | 0.94 | -0.09 |