Climate Change Chart of Ischia, Italy
Comprehensive Climate Change Chart of Ischia, Italy: Monthly Averages and Impact Trends
Explore the changing climate in Ischia, Italy with our detailed analysis of temperature, rainfall, snowfall, and sunshine duration data. Discover the trends and impacts of climate change in this beautiful region.
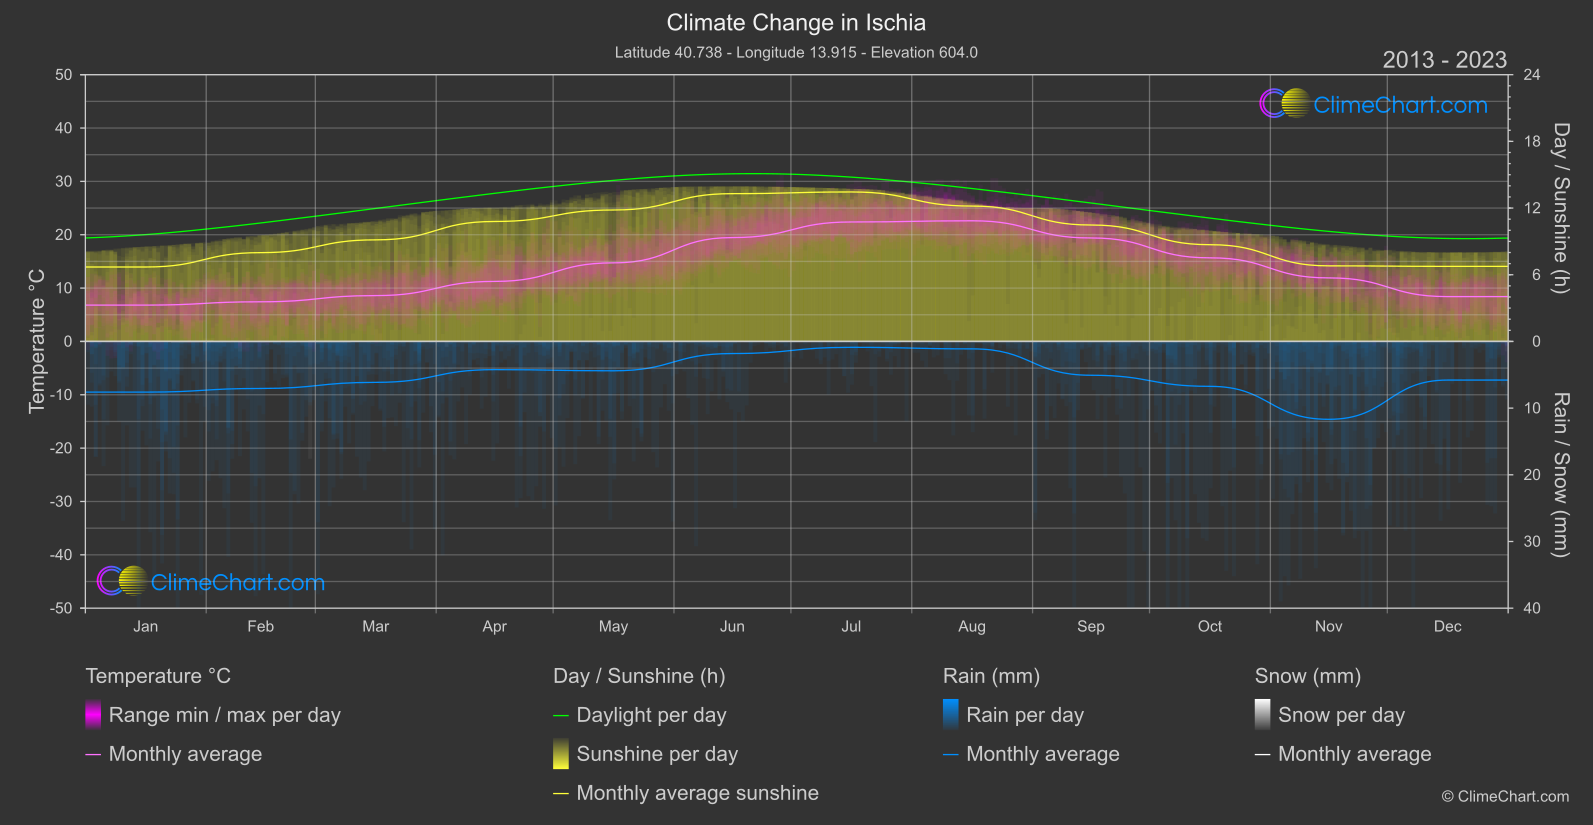
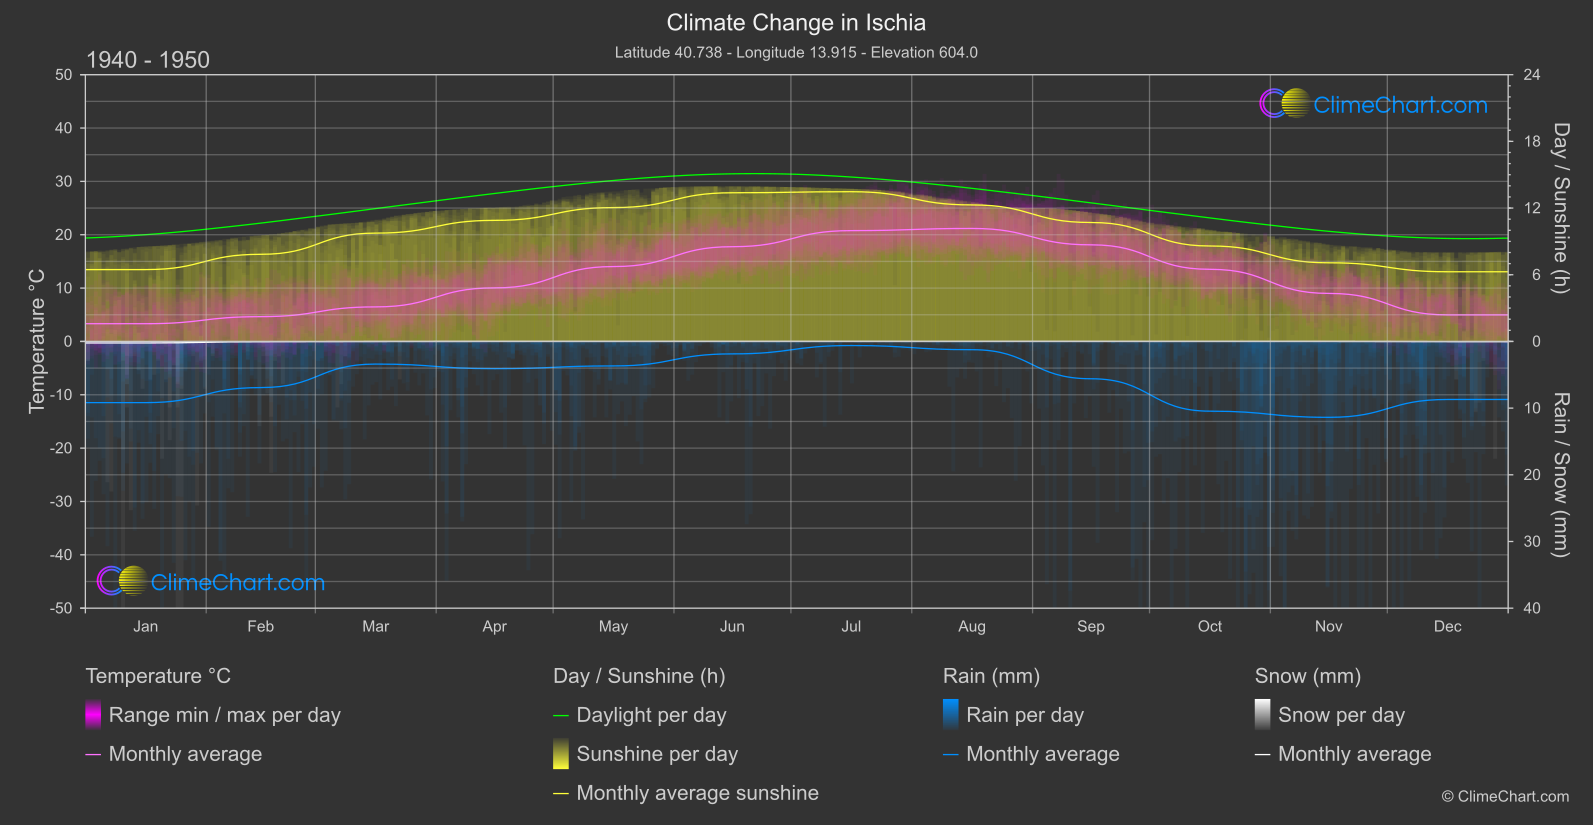
Ischia, a picturesque island in Italy, has been experiencing notable changes in its climate over the years. Our data comparison between the periods of 1940 - 1950 and 2013 - 2024 reveals interesting insights. The month with the highest temperature change is December, with a significant increase of 3.43°C. On the other hand, March shows the highest rainfall change with a 1.37mm increase. Snowfall has decreased overall, with notable changes in January and December. Sunshine duration has slightly decreased in most months, with the highest change in November at -0.27 hours.
Climate Change Data Overview for Ischia, Italy
Explore the comprehensive climate change data for Ischia, Italy. This detailed table provides valuable insights into temperature variations, precipitation levels, and seasonal changes influenced by climate change, helping you understand the unique weather patterns of this region.
Temperature °C
| Month | ⌀ 1940 - 1950 | ⌀ 2013 - 2023 | +/- |
|---|---|---|---|
| Jan | 3.32 | 6.81 | 3.48 |
| Feb | 4.64 | 7.43 | 2.79 |
| Mar | 6.47 | 8.59 | 2.12 |
| Apr | 10.04 | 11.25 | 1.21 |
| May | 14.03 | 14.73 | 0.69 |
| Jun | 17.76 | 19.47 | 1.71 |
| Jul | 20.77 | 22.39 | 1.62 |
| Aug | 21.18 | 22.61 | 1.44 |
| Sep | 18.11 | 19.40 | 1.29 |
| Oct | 13.52 | 15.67 | 2.15 |
| Nov | 9.00 | 11.91 | 2.91 |
| Dec | 4.98 | 8.40 | 3.43 |
| ⌀ Month | 11.98 | 14.05 | 2.07 |
Sunshine (h)
| Month | ⌀ 1940 - 1950 | ⌀ 2013 - 2023 | +/- |
|---|---|---|---|
| Jan | 6.46 | 6.70 | 0.23 |
| Feb | 7.84 | 7.99 | 0.15 |
| Mar | 9.75 | 9.14 | -0.61 |
| Apr | 10.89 | 10.79 | -0.10 |
| May | 12.04 | 11.83 | -0.22 |
| Jun | 13.38 | 13.30 | -0.08 |
| Jul | 13.47 | 13.45 | -0.02 |
| Aug | 12.28 | 12.18 | -0.10 |
| Sep | 10.70 | 10.47 | -0.23 |
| Oct | 8.59 | 8.70 | 0.12 |
| Nov | 7.07 | 6.80 | -0.27 |
| Dec | 6.27 | 6.75 | 0.48 |
| ⌀ Month | 9.90 | 9.84 | -0.05 |
Rain (mm)
| Month | ⌀ 1940 - 1950 | ⌀ 2013 - 2023 | +/- |
|---|---|---|---|
| Jan | 4.59 | 3.80 | -0.79 |
| Feb | 3.46 | 3.53 | 0.07 |
| Mar | 1.70 | 3.07 | 1.37 |
| Apr | 2.04 | 2.11 | 0.07 |
| May | 1.84 | 2.20 | 0.37 |
| Jun | 0.93 | 0.91 | -0.03 |
| Jul | 0.31 | 0.44 | 0.13 |
| Aug | 0.62 | 0.56 | -0.06 |
| Sep | 2.80 | 2.54 | -0.26 |
| Oct | 5.23 | 3.37 | -1.86 |
| Nov | 5.69 | 5.84 | 0.15 |
| Dec | 4.35 | 2.90 | -1.45 |
| ⌀ Month | 2.80 | 2.60 | -0.19 |
Snow (mm)
| Month | ⌀ 1940 - 1950 | ⌀ 2013 - 2023 | +/- |
|---|---|---|---|
| Jan | 0.12 | 0.00 | -0.12 |
| Feb | 0.02 | 0.01 | -0.02 |
| Mar | 0.01 | 0.00 | -0.01 |
| Apr | 0.00 | 0.00 | 0.00 |
| May | 0.00 | 0.00 | 0.00 |
| Jun | 0.00 | 0.00 | 0.00 |
| Jul | 0.00 | 0.00 | 0.00 |
| Aug | 0.00 | 0.00 | 0.00 |
| Sep | 0.00 | 0.00 | 0.00 |
| Oct | 0.00 | 0.00 | 0.00 |
| Nov | 0.00 | 0.00 | 0.00 |
| Dec | 0.02 | 0.00 | -0.02 |
| ⌀ Month | 0.01 | 0.00 | -0.01 |