Climate Change Chart of Iribarren (Barquisimeto), Venezuela
Comprehensive Climate Change Chart of Iribarren (Barquisimeto), Venezuela: Monthly Averages and Impact Trends
Exploring the changing climate in Iribarren (Barquisimeto), Venezuela reveals intriguing insights. Discover how temperature, rainfall, and sunshine duration have evolved over the years.
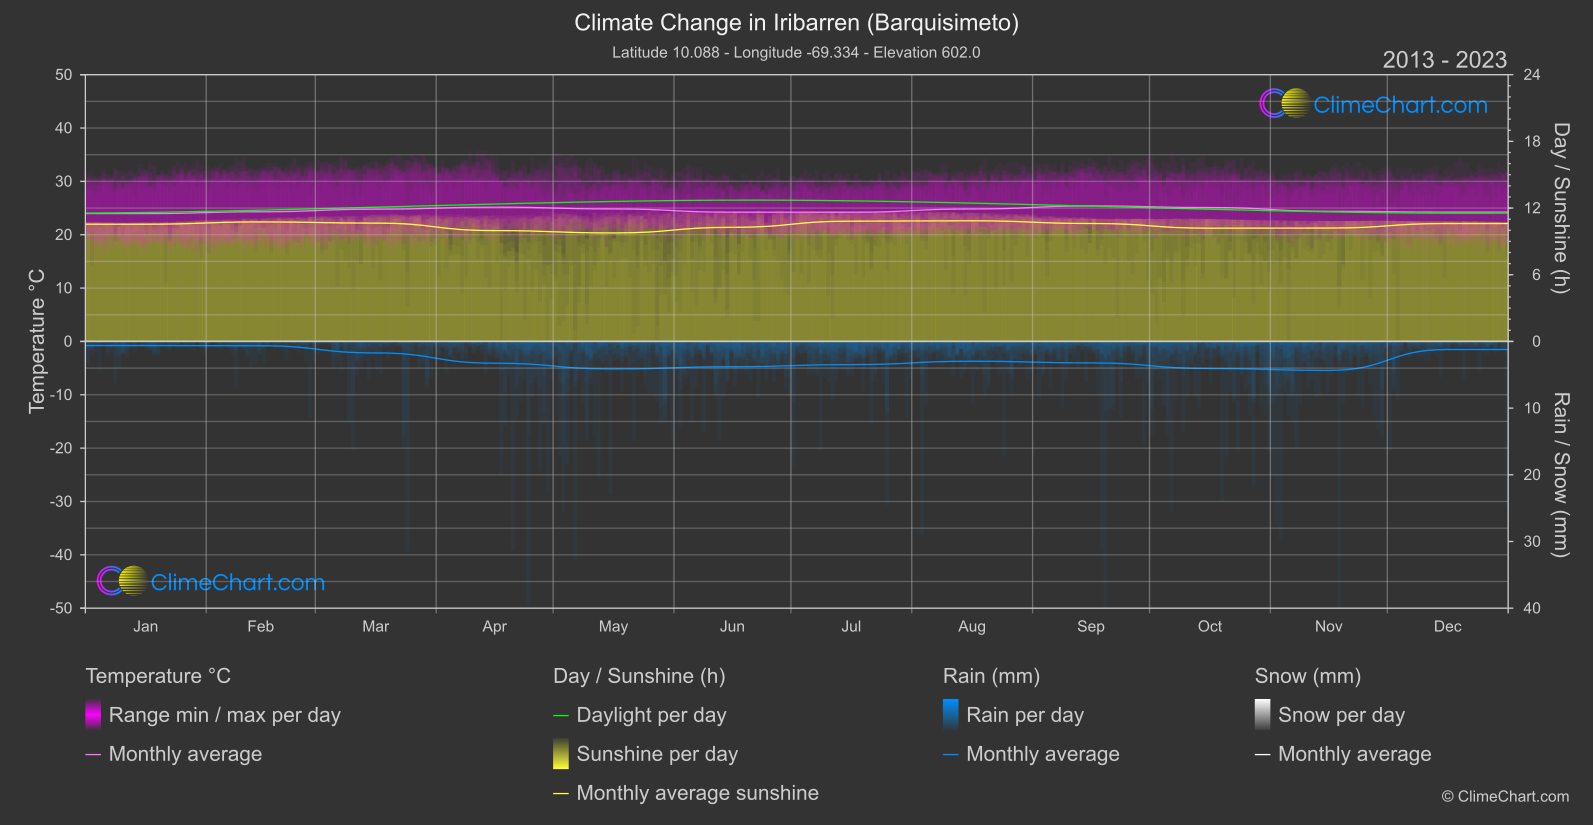
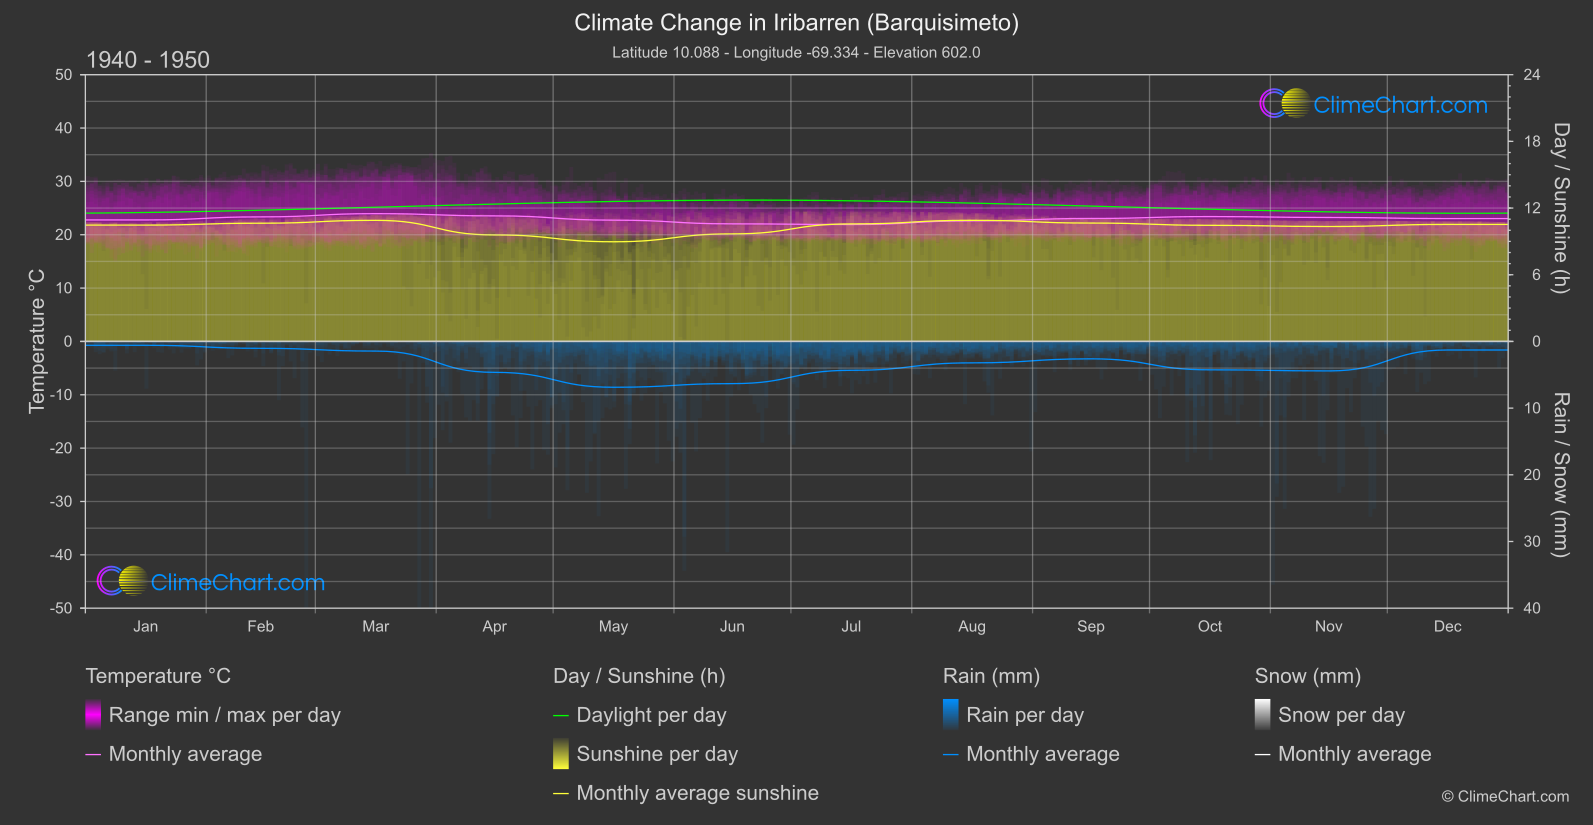
Iribarren (Barquisimeto), Venezuela has witnessed notable changes in its climate patterns. Analyzing the temperature data from 1940 to 1950 compared to 2013 to 2024 shows a consistent increase in temperatures across most months. The month of June stands out with the highest temperature change of 2.19°C, indicating a significant warming trend. Additionally, examining the rainfall data reveals fluctuating patterns with some months experiencing a decrease in rainfall, such as February, while others, like May, showing a substantial decrease. When it comes to sunshine duration, the data highlights varying trends throughout the year, with notable changes in months like April and June. Overall, these insights provide valuable information on the evolving climate in Iribarren (Barquisimeto), Venezuela.
Climate Change Data Overview for Iribarren (Barquisimeto), Venezuela
Explore the comprehensive climate change data for Iribarren (Barquisimeto), Venezuela. This detailed table provides valuable insights into temperature variations, precipitation levels, and seasonal changes influenced by climate change, helping you understand the unique weather patterns of this region.
Temperature °C
| Month | ⌀ 1940 - 1950 | ⌀ 2013 - 2023 | +/- |
|---|---|---|---|
| Jan | 22.77 | 23.97 | 1.19 |
| Feb | 23.35 | 24.30 | 0.96 |
| Mar | 23.95 | 24.79 | 0.83 |
| Apr | 23.53 | 25.17 | 1.63 |
| May | 22.73 | 24.83 | 2.10 |
| Jun | 22.04 | 24.23 | 2.19 |
| Jul | 21.91 | 24.21 | 2.30 |
| Aug | 22.60 | 24.82 | 2.22 |
| Sep | 23.05 | 25.40 | 2.35 |
| Oct | 23.40 | 25.10 | 1.70 |
| Nov | 23.24 | 24.39 | 1.16 |
| Dec | 23.03 | 24.25 | 1.22 |
| ⌀ Month | 22.97 | 24.62 | 1.65 |
Sunshine (h)
| Month | ⌀ 1940 - 1950 | ⌀ 2013 - 2023 | +/- |
|---|---|---|---|
| Jan | 10.47 | 10.55 | 0.08 |
| Feb | 10.64 | 10.75 | 0.12 |
| Mar | 10.89 | 10.64 | -0.25 |
| Apr | 9.58 | 9.97 | 0.39 |
| May | 8.97 | 9.76 | 0.79 |
| Jun | 9.68 | 10.27 | 0.59 |
| Jul | 10.57 | 10.82 | 0.25 |
| Aug | 10.90 | 10.85 | -0.04 |
| Sep | 10.65 | 10.61 | -0.04 |
| Oct | 10.45 | 10.19 | -0.26 |
| Nov | 10.34 | 10.20 | -0.14 |
| Dec | 10.53 | 10.61 | 0.08 |
| ⌀ Month | 10.30 | 10.44 | 0.13 |
Rain (mm)
| Month | ⌀ 1940 - 1950 | ⌀ 2013 - 2023 | +/- |
|---|---|---|---|
| Jan | 0.29 | 0.31 | 0.02 |
| Feb | 0.52 | 0.33 | -0.19 |
| Mar | 0.72 | 0.86 | 0.14 |
| Apr | 2.32 | 1.63 | -0.68 |
| May | 3.44 | 2.06 | -1.37 |
| Jun | 3.16 | 1.89 | -1.27 |
| Jul | 2.17 | 1.74 | -0.43 |
| Aug | 1.61 | 1.49 | -0.12 |
| Sep | 1.31 | 1.61 | 0.30 |
| Oct | 2.13 | 2.03 | -0.10 |
| Nov | 2.21 | 2.17 | -0.04 |
| Dec | 0.64 | 0.60 | -0.04 |
| ⌀ Month | 1.71 | 1.39 | -0.31 |
Snow (mm)
| Month | ⌀ 1940 - 1950 | ⌀ 2013 - 2023 | +/- |
|---|---|---|---|
| Jan | 0.00 | 0.00 | 0.00 |
| Feb | 0.00 | 0.00 | 0.00 |
| Mar | 0.00 | 0.00 | 0.00 |
| Apr | 0.00 | 0.00 | 0.00 |
| May | 0.00 | 0.00 | 0.00 |
| Jun | 0.00 | 0.00 | 0.00 |
| Jul | 0.00 | 0.00 | 0.00 |
| Aug | 0.00 | 0.00 | 0.00 |
| Sep | 0.00 | 0.00 | 0.00 |
| Oct | 0.00 | 0.00 | 0.00 |
| Nov | 0.00 | 0.00 | 0.00 |
| Dec | 0.00 | 0.00 | 0.00 |
| ⌀ Month | 0.00 | 0.00 | 0.00 |