Climate Change Chart of Indianapolis, USA
Comprehensive Climate Change Chart of Indianapolis, USA: Monthly Averages and Impact Trends
Exploring the changing climate in Indianapolis, USA reveals fascinating insights into temperature, rainfall, snowfall, and sunshine duration trends.
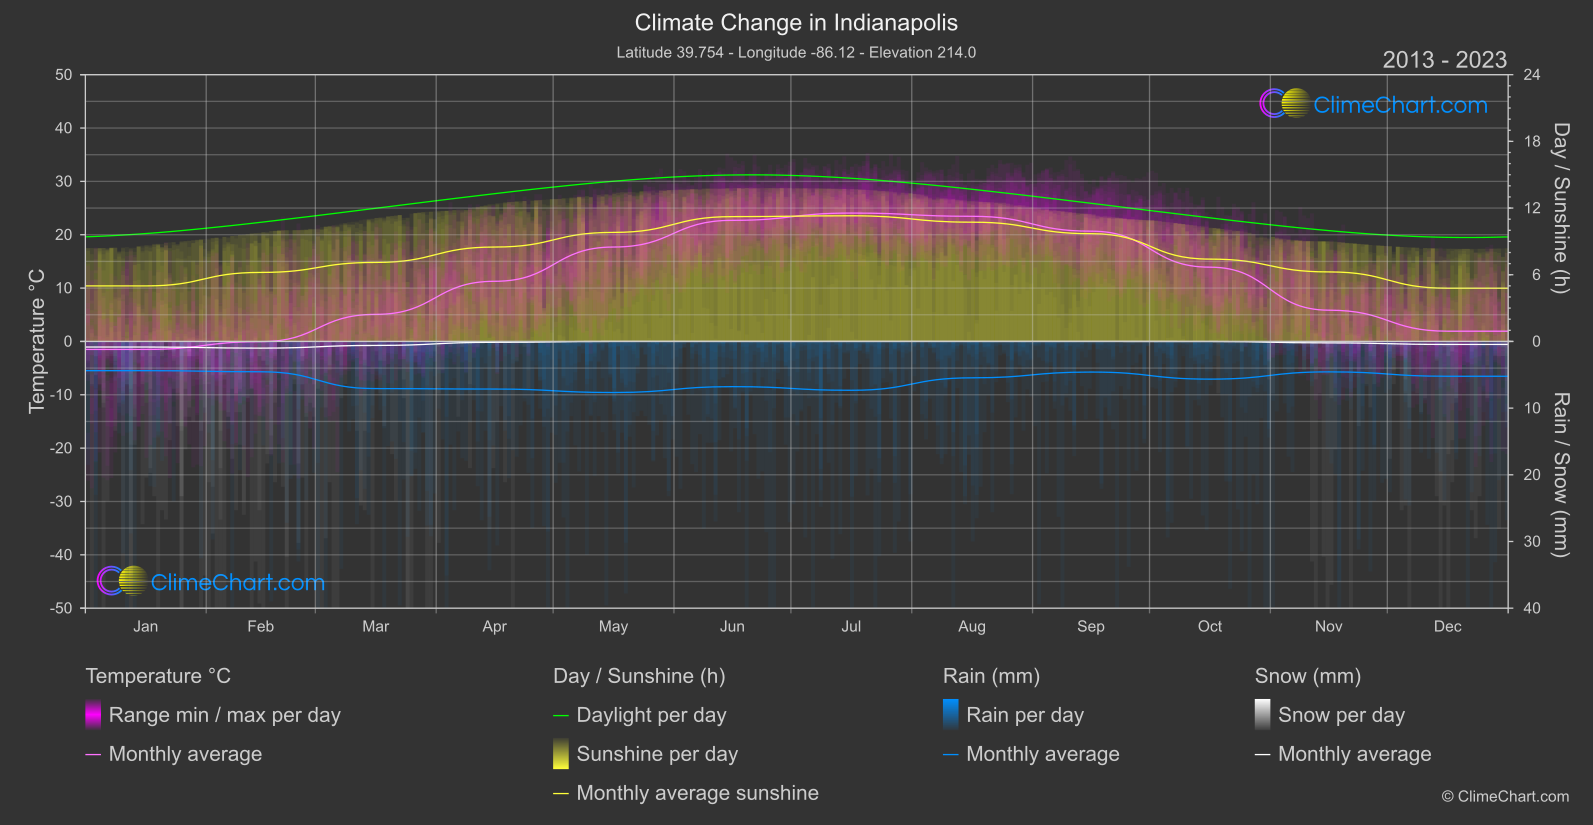
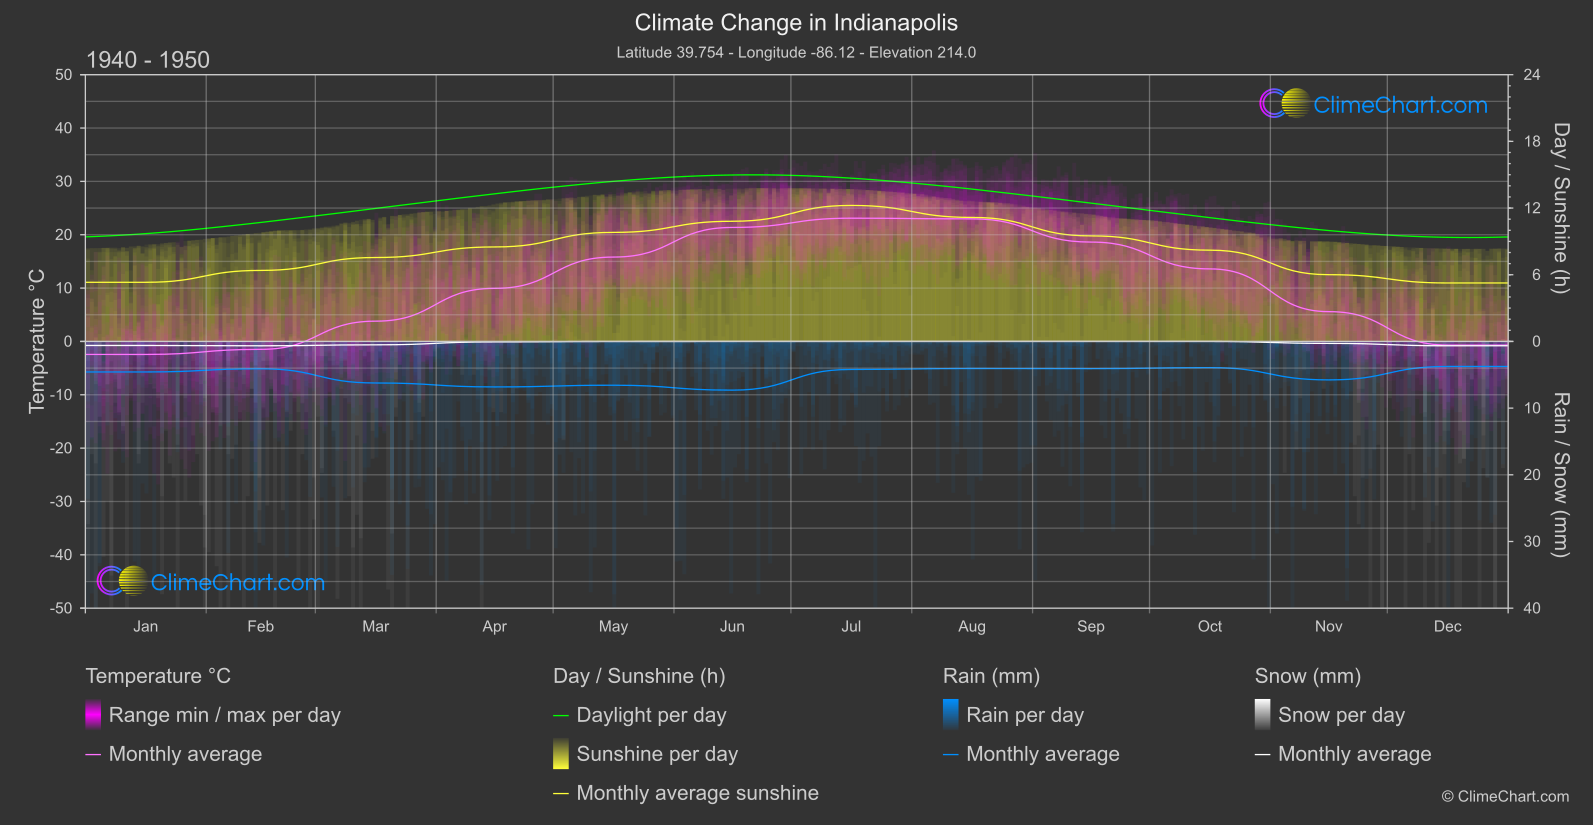
Indianapolis, USA, has experienced notable changes in climate over the years. Analyzing the data from the 1940s to the 1950s compared to 2013 to 2024, we observe a consistent increase in temperatures across most months, with September showing the highest rise. In terms of rainfall, there are fluctuations with July experiencing a significant increase. Snowfall has decreased in general, with December showing the most considerable drop. Sunshine duration has varied, with June seeing a substantial increase and July having a notable decrease.
Climate Change Data Overview for Indianapolis, USA
Explore the comprehensive climate change data for Indianapolis, USA. This detailed table provides valuable insights into temperature variations, precipitation levels, and seasonal changes influenced by climate change, helping you understand the unique weather patterns of this region.
Temperature °C
| Month | ⌀ 1940 - 1950 | ⌀ 2013 - 2023 | +/- |
|---|---|---|---|
| Jan | -2.44 | -1.50 | 0.94 |
| Feb | -1.48 | -0.04 | 1.44 |
| Mar | 3.80 | 5.07 | 1.27 |
| Apr | 9.95 | 11.27 | 1.32 |
| May | 15.81 | 17.69 | 1.88 |
| Jun | 21.37 | 22.70 | 1.33 |
| Jul | 23.10 | 24.06 | 0.96 |
| Aug | 22.97 | 23.45 | 0.48 |
| Sep | 18.62 | 20.67 | 2.04 |
| Oct | 13.60 | 13.92 | 0.32 |
| Nov | 5.58 | 5.86 | 0.27 |
| Dec | -0.68 | 1.92 | 2.60 |
| ⌀ Month | 10.85 | 12.09 | 1.24 |
Sunshine (h)
| Month | ⌀ 1940 - 1950 | ⌀ 2013 - 2023 | +/- |
|---|---|---|---|
| Jan | 5.32 | 5.00 | -0.33 |
| Feb | 6.39 | 6.21 | -0.18 |
| Mar | 7.55 | 7.11 | -0.44 |
| Apr | 8.50 | 8.49 | -0.01 |
| May | 9.81 | 9.81 | -0.00 |
| Jun | 10.81 | 11.23 | 0.42 |
| Jul | 12.23 | 11.30 | -0.93 |
| Aug | 11.16 | 10.73 | -0.43 |
| Sep | 9.50 | 9.69 | 0.20 |
| Oct | 8.21 | 7.41 | -0.80 |
| Nov | 6.01 | 6.25 | 0.25 |
| Dec | 5.26 | 4.79 | -0.47 |
| ⌀ Month | 8.40 | 8.17 | -0.23 |
Rain (mm)
| Month | ⌀ 1940 - 1950 | ⌀ 2013 - 2023 | +/- |
|---|---|---|---|
| Jan | 2.29 | 2.19 | -0.10 |
| Feb | 2.05 | 2.27 | 0.22 |
| Mar | 3.12 | 3.54 | 0.42 |
| Apr | 3.41 | 3.57 | 0.16 |
| May | 3.28 | 3.83 | 0.55 |
| Jun | 3.65 | 3.39 | -0.26 |
| Jul | 2.10 | 3.66 | 1.56 |
| Aug | 2.03 | 2.73 | 0.70 |
| Sep | 2.04 | 2.30 | 0.26 |
| Oct | 1.96 | 2.83 | 0.86 |
| Nov | 2.88 | 2.28 | -0.60 |
| Dec | 1.88 | 2.61 | 0.73 |
| ⌀ Month | 2.56 | 2.93 | 0.38 |
Snow (mm)
| Month | ⌀ 1940 - 1950 | ⌀ 2013 - 2023 | +/- |
|---|---|---|---|
| Jan | 0.30 | 0.42 | 0.12 |
| Feb | 0.33 | 0.50 | 0.17 |
| Mar | 0.25 | 0.30 | 0.05 |
| Apr | 0.04 | 0.07 | 0.03 |
| May | 0.00 | 0.00 | -0.00 |
| Jun | 0.00 | 0.00 | 0.00 |
| Jul | 0.00 | 0.00 | 0.00 |
| Aug | 0.00 | 0.00 | 0.00 |
| Sep | 0.00 | 0.00 | 0.00 |
| Oct | 0.00 | 0.01 | 0.01 |
| Nov | 0.15 | 0.11 | -0.04 |
| Dec | 0.33 | 0.22 | -0.10 |
| ⌀ Month | 0.12 | 0.14 | 0.02 |