Climate Change Chart of Hua Hin, Thailand
Comprehensive Climate Change Chart of Hua Hin, Thailand: Monthly Averages and Impact Trends
Explore the changing climate in Hua Hin, Thailand, through insightful data analysis. Discover how temperatures, rainfall, and sunshine duration have evolved from 1940 to 1950 compared to 2013 to 2024.
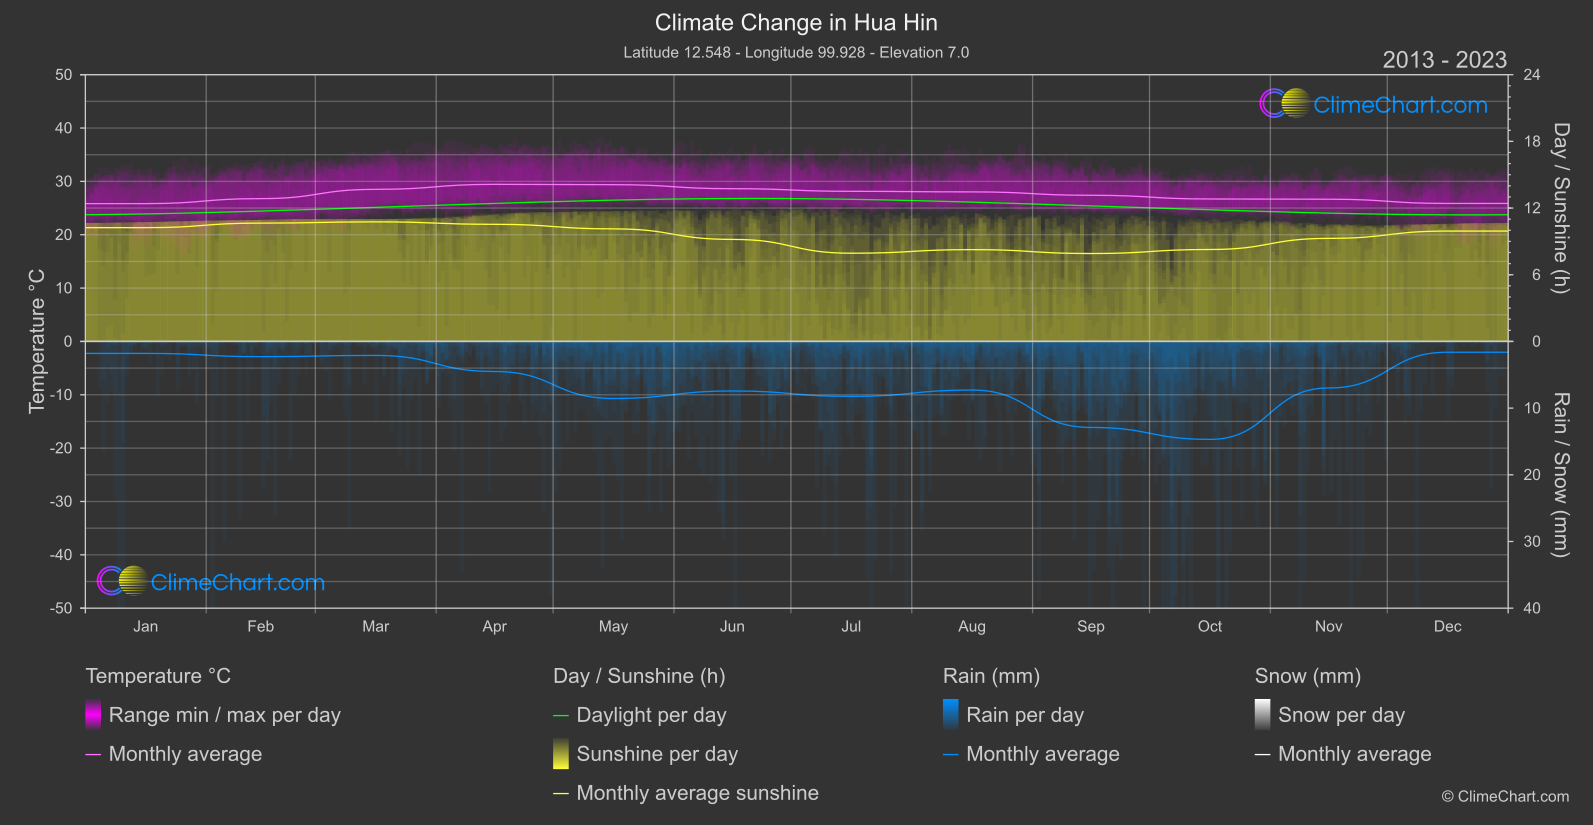
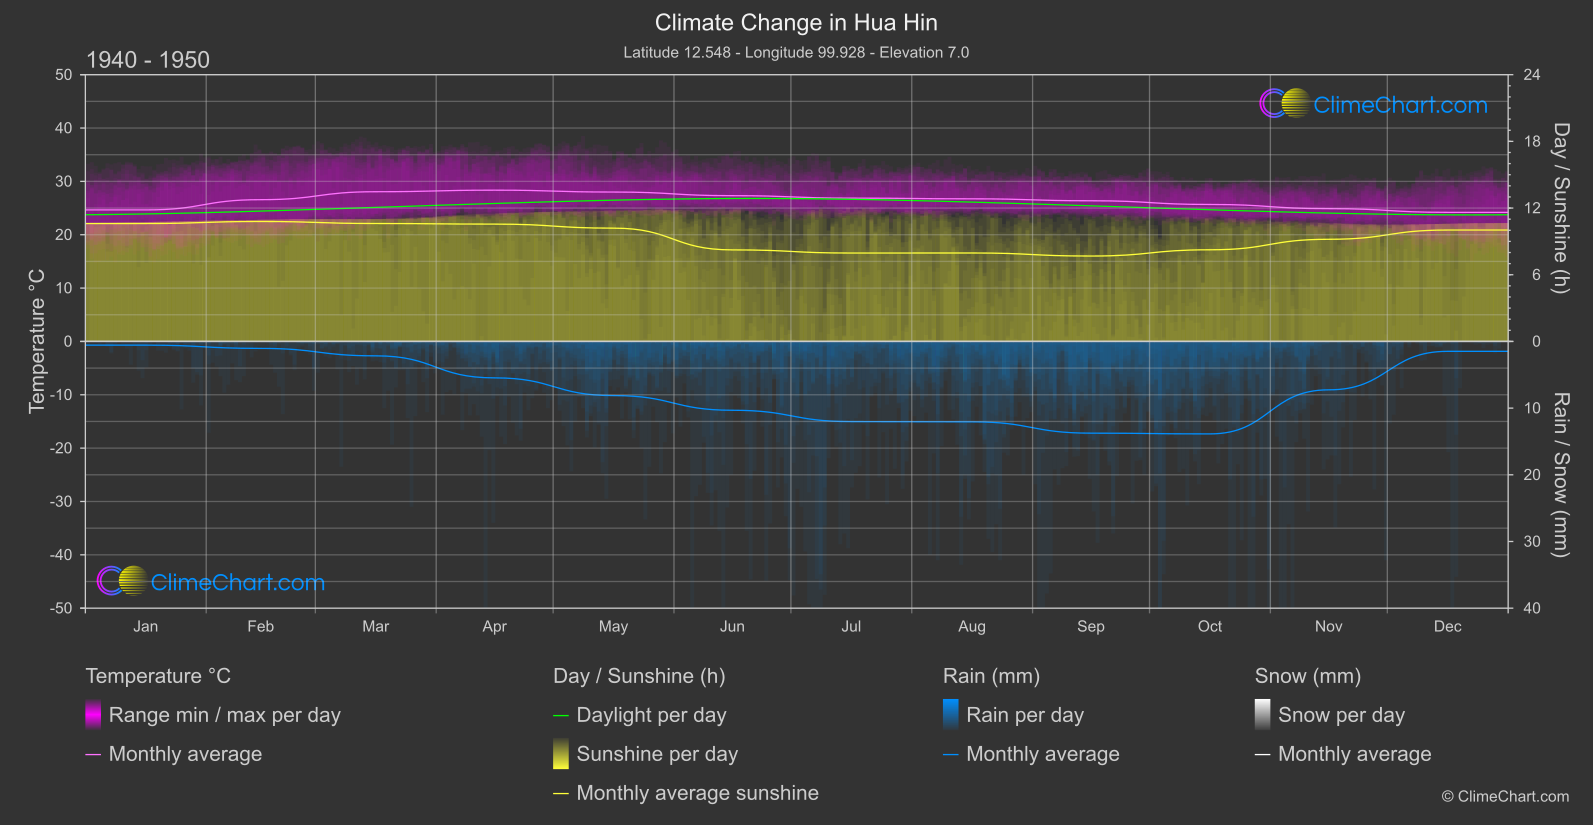
Hua Hin, a coastal city in Thailand, has experienced significant climate changes over the years. The data from 1940 to 1950 compared to 2013 to 2024 shows a noticeable increase in average temperatures across all months, with November exhibiting the highest temperature change of approximately 1.77°C. In terms of rainfall, the data reveals varying patterns with some months experiencing a decrease while others show an increase in precipitation. June saw the most significant drop in rainfall, with a decrease of around 1.45 mm. Sunshine duration also fluctuated, with notable changes in June and August showing contrasting trends. Understanding these climate shifts is crucial for adapting to and mitigating the impacts of climate change in Hua Hin.
Climate Change Data Overview for Hua Hin, Thailand
Explore the comprehensive climate change data for Hua Hin, Thailand. This detailed table provides valuable insights into temperature variations, precipitation levels, and seasonal changes influenced by climate change, helping you understand the unique weather patterns of this region.
Temperature °C
| Month | ⌀ 1940 - 1950 | ⌀ 2013 - 2023 | +/- |
|---|---|---|---|
| Jan | 24.65 | 25.83 | 1.18 |
| Feb | 26.57 | 26.77 | 0.20 |
| Mar | 28.06 | 28.51 | 0.45 |
| Apr | 28.35 | 29.45 | 1.10 |
| May | 28.00 | 29.38 | 1.38 |
| Jun | 27.32 | 28.63 | 1.31 |
| Jul | 26.86 | 28.14 | 1.28 |
| Aug | 26.73 | 28.03 | 1.30 |
| Sep | 26.37 | 27.39 | 1.03 |
| Oct | 25.67 | 26.70 | 1.03 |
| Nov | 24.89 | 26.66 | 1.77 |
| Dec | 24.20 | 25.86 | 1.67 |
| ⌀ Month | 26.47 | 27.61 | 1.14 |
Sunshine (h)
| Month | ⌀ 1940 - 1950 | ⌀ 2013 - 2023 | +/- |
|---|---|---|---|
| Jan | 10.61 | 10.24 | -0.37 |
| Feb | 10.79 | 10.65 | -0.15 |
| Mar | 10.61 | 10.76 | 0.15 |
| Apr | 10.56 | 10.54 | -0.02 |
| May | 10.19 | 10.13 | -0.07 |
| Jun | 8.24 | 9.18 | 0.94 |
| Jul | 7.95 | 7.94 | -0.02 |
| Aug | 7.96 | 8.26 | 0.30 |
| Sep | 7.68 | 7.91 | 0.23 |
| Oct | 8.25 | 8.27 | 0.03 |
| Nov | 9.19 | 9.27 | 0.08 |
| Dec | 10.02 | 9.93 | -0.09 |
| ⌀ Month | 9.34 | 9.42 | 0.08 |
Rain (mm)
| Month | ⌀ 1940 - 1950 | ⌀ 2013 - 2023 | +/- |
|---|---|---|---|
| Jan | 0.28 | 0.90 | 0.62 |
| Feb | 0.52 | 1.14 | 0.62 |
| Mar | 1.08 | 1.05 | -0.03 |
| Apr | 2.73 | 2.26 | -0.48 |
| May | 4.06 | 4.28 | 0.22 |
| Jun | 5.16 | 3.71 | -1.45 |
| Jul | 6.01 | 4.12 | -1.89 |
| Aug | 6.03 | 3.65 | -2.38 |
| Sep | 6.88 | 6.45 | -0.43 |
| Oct | 6.93 | 7.34 | 0.41 |
| Nov | 3.63 | 3.49 | -0.14 |
| Dec | 0.74 | 0.81 | 0.07 |
| ⌀ Month | 3.67 | 3.27 | -0.41 |
Snow (mm)
| Month | ⌀ 1940 - 1950 | ⌀ 2013 - 2023 | +/- |
|---|---|---|---|
| Jan | 0.00 | 0.00 | 0.00 |
| Feb | 0.00 | 0.00 | 0.00 |
| Mar | 0.00 | 0.00 | 0.00 |
| Apr | 0.00 | 0.00 | 0.00 |
| May | 0.00 | 0.00 | 0.00 |
| Jun | 0.00 | 0.00 | 0.00 |
| Jul | 0.00 | 0.00 | 0.00 |
| Aug | 0.00 | 0.00 | 0.00 |
| Sep | 0.00 | 0.00 | 0.00 |
| Oct | 0.00 | 0.00 | 0.00 |
| Nov | 0.00 | 0.00 | 0.00 |
| Dec | 0.00 | 0.00 | 0.00 |
| ⌀ Month | 0.00 | 0.00 | 0.00 |