Climate Change Chart of Honolulu, USA
Comprehensive Climate Change Chart of Honolulu, USA: Monthly Averages and Impact Trends
Explore the changing climate in Honolulu, United States of America with insights from temperature, rainfall, and sunshine duration data.
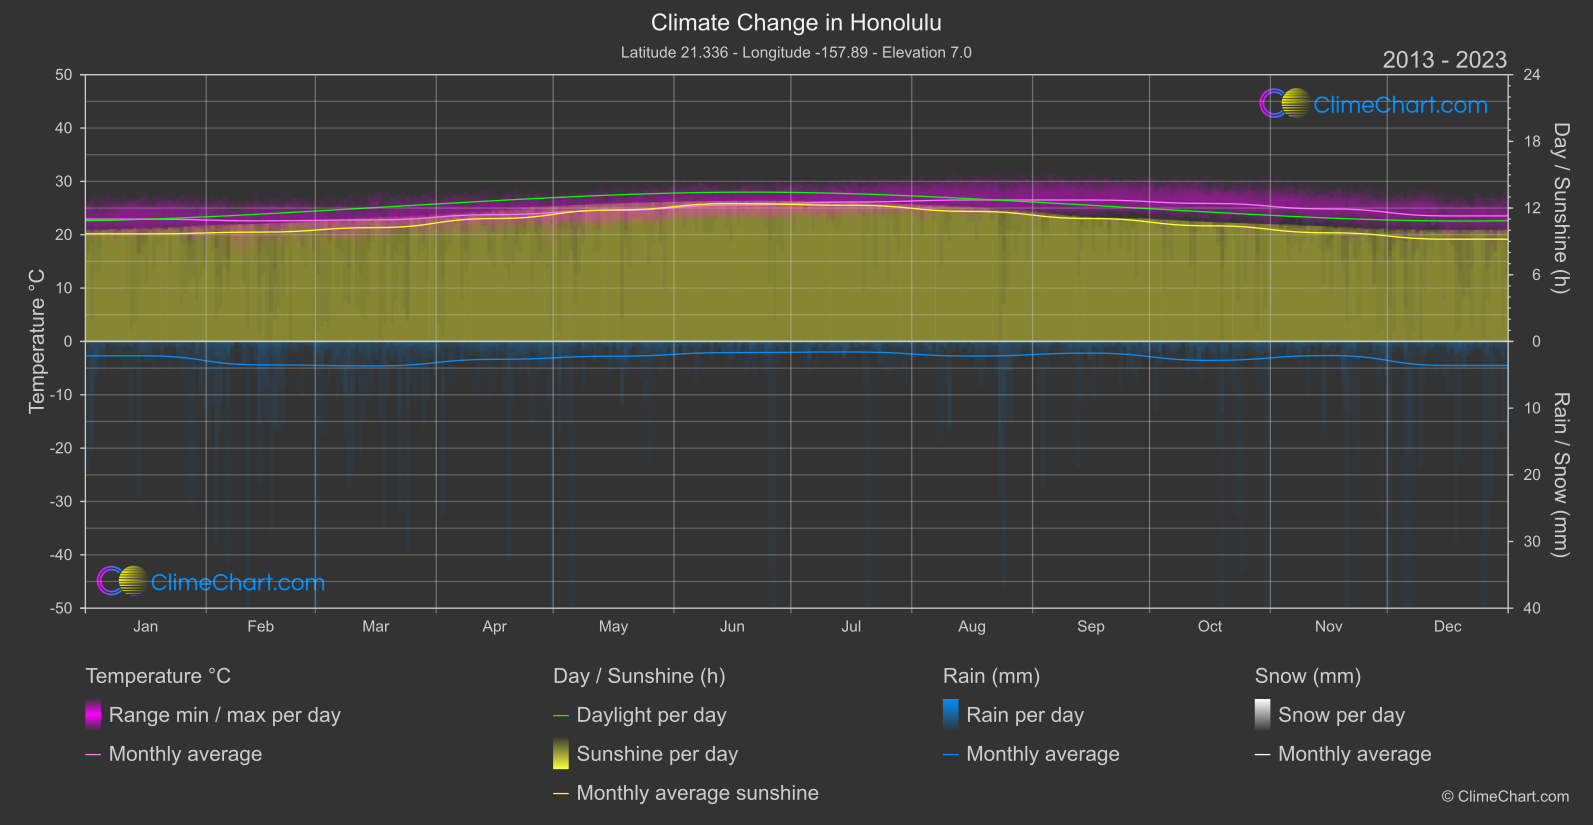
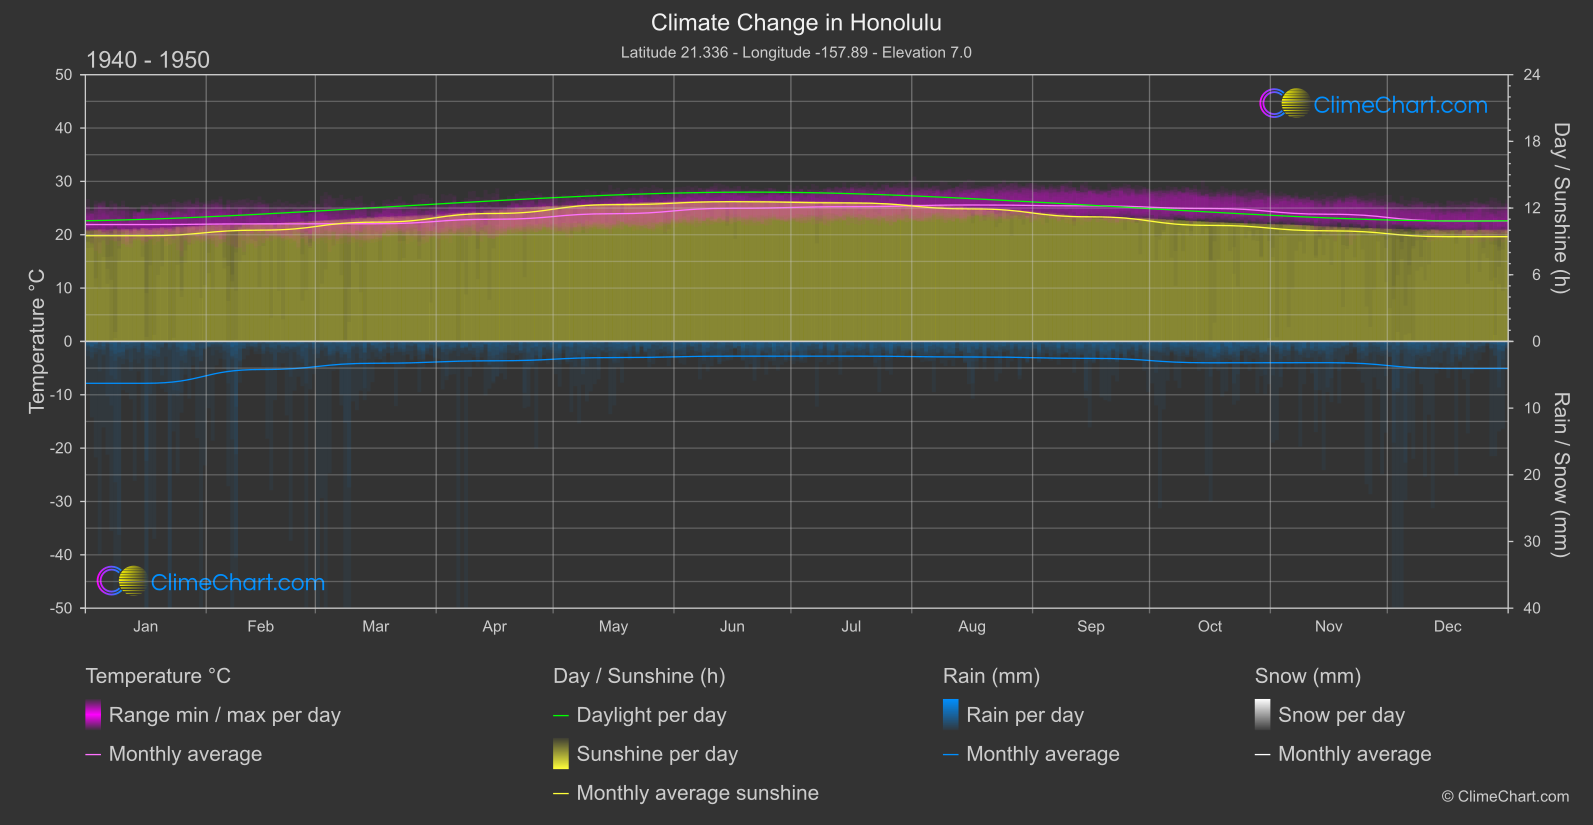
Honolulu, located in the United States of America, experiences noticeable changes in temperature, rainfall, and sunshine duration. Analyzing the data for the period from 1940 to 1950 compared to 2013 to 2024 reveals interesting trends. For example, the month with the highest temperature change is September, with an increase of 1.1°C. Conversely, the month with the most significant decrease in rainfall is November, with a reduction of 0.54 mm. Additionally, there is a clear decline in sunshine duration over the years, with December showing the highest decrease of 0.23 hours.
Climate Change Data Overview for Honolulu, USA
Explore the comprehensive climate change data for Honolulu, USA. This detailed table provides valuable insights into temperature variations, precipitation levels, and seasonal changes influenced by climate change, helping you understand the unique weather patterns of this region.
Temperature °C
| Month | ⌀ 1940 - 1950 | ⌀ 2013 - 2023 | +/- |
|---|---|---|---|
| Jan | 21.91 | 22.93 | 1.02 |
| Feb | 22.04 | 22.60 | 0.57 |
| Mar | 22.06 | 22.78 | 0.72 |
| Apr | 22.90 | 23.77 | 0.86 |
| May | 23.94 | 24.56 | 0.62 |
| Jun | 24.96 | 25.53 | 0.57 |
| Jul | 25.26 | 26.13 | 0.88 |
| Aug | 25.58 | 26.52 | 0.94 |
| Sep | 25.41 | 26.50 | 1.10 |
| Oct | 24.91 | 25.86 | 0.95 |
| Nov | 23.84 | 24.84 | 1.00 |
| Dec | 22.61 | 23.53 | 0.92 |
| ⌀ Month | 23.79 | 24.63 | 0.85 |
Sunshine (h)
| Month | ⌀ 1940 - 1950 | ⌀ 2013 - 2023 | +/- |
|---|---|---|---|
| Jan | 9.51 | 9.68 | 0.16 |
| Feb | 10.01 | 9.84 | -0.18 |
| Mar | 10.73 | 10.24 | -0.49 |
| Apr | 11.51 | 11.06 | -0.46 |
| May | 12.30 | 11.83 | -0.48 |
| Jun | 12.57 | 12.41 | -0.17 |
| Jul | 12.46 | 12.25 | -0.21 |
| Aug | 11.92 | 11.70 | -0.22 |
| Sep | 11.21 | 11.06 | -0.15 |
| Oct | 10.44 | 10.40 | -0.04 |
| Nov | 9.95 | 9.77 | -0.18 |
| Dec | 9.43 | 9.20 | -0.23 |
| ⌀ Month | 11.00 | 10.79 | -0.22 |
Rain (mm)
| Month | ⌀ 1940 - 1950 | ⌀ 2013 - 2023 | +/- |
|---|---|---|---|
| Jan | 3.14 | 1.08 | -2.06 |
| Feb | 2.11 | 1.75 | -0.35 |
| Mar | 1.64 | 1.84 | 0.20 |
| Apr | 1.45 | 1.34 | -0.11 |
| May | 1.21 | 1.11 | -0.10 |
| Jun | 1.10 | 0.84 | -0.27 |
| Jul | 1.10 | 0.79 | -0.31 |
| Aug | 1.17 | 1.10 | -0.07 |
| Sep | 1.27 | 0.88 | -0.39 |
| Oct | 1.60 | 1.42 | -0.18 |
| Nov | 1.59 | 1.06 | -0.54 |
| Dec | 2.03 | 1.80 | -0.22 |
| ⌀ Month | 1.62 | 1.25 | -0.37 |
Snow (mm)
| Month | ⌀ 1940 - 1950 | ⌀ 2013 - 2023 | +/- |
|---|---|---|---|
| Jan | 0.00 | 0.00 | 0.00 |
| Feb | 0.00 | 0.00 | 0.00 |
| Mar | 0.00 | 0.00 | 0.00 |
| Apr | 0.00 | 0.00 | 0.00 |
| May | 0.00 | 0.00 | 0.00 |
| Jun | 0.00 | 0.00 | 0.00 |
| Jul | 0.00 | 0.00 | 0.00 |
| Aug | 0.00 | 0.00 | 0.00 |
| Sep | 0.00 | 0.00 | 0.00 |
| Oct | 0.00 | 0.00 | 0.00 |
| Nov | 0.00 | 0.00 | 0.00 |
| Dec | 0.00 | 0.00 | 0.00 |
| ⌀ Month | 0.00 | 0.00 | 0.00 |