Climate Change Chart of Hiroshima, Japan
Comprehensive Climate Change Chart of Hiroshima, Japan: Monthly Averages and Impact Trends
Explore the climate change data for Hiroshima, Japan, and uncover the trends in temperature, rainfall, snowfall, and sunshine duration over the years.
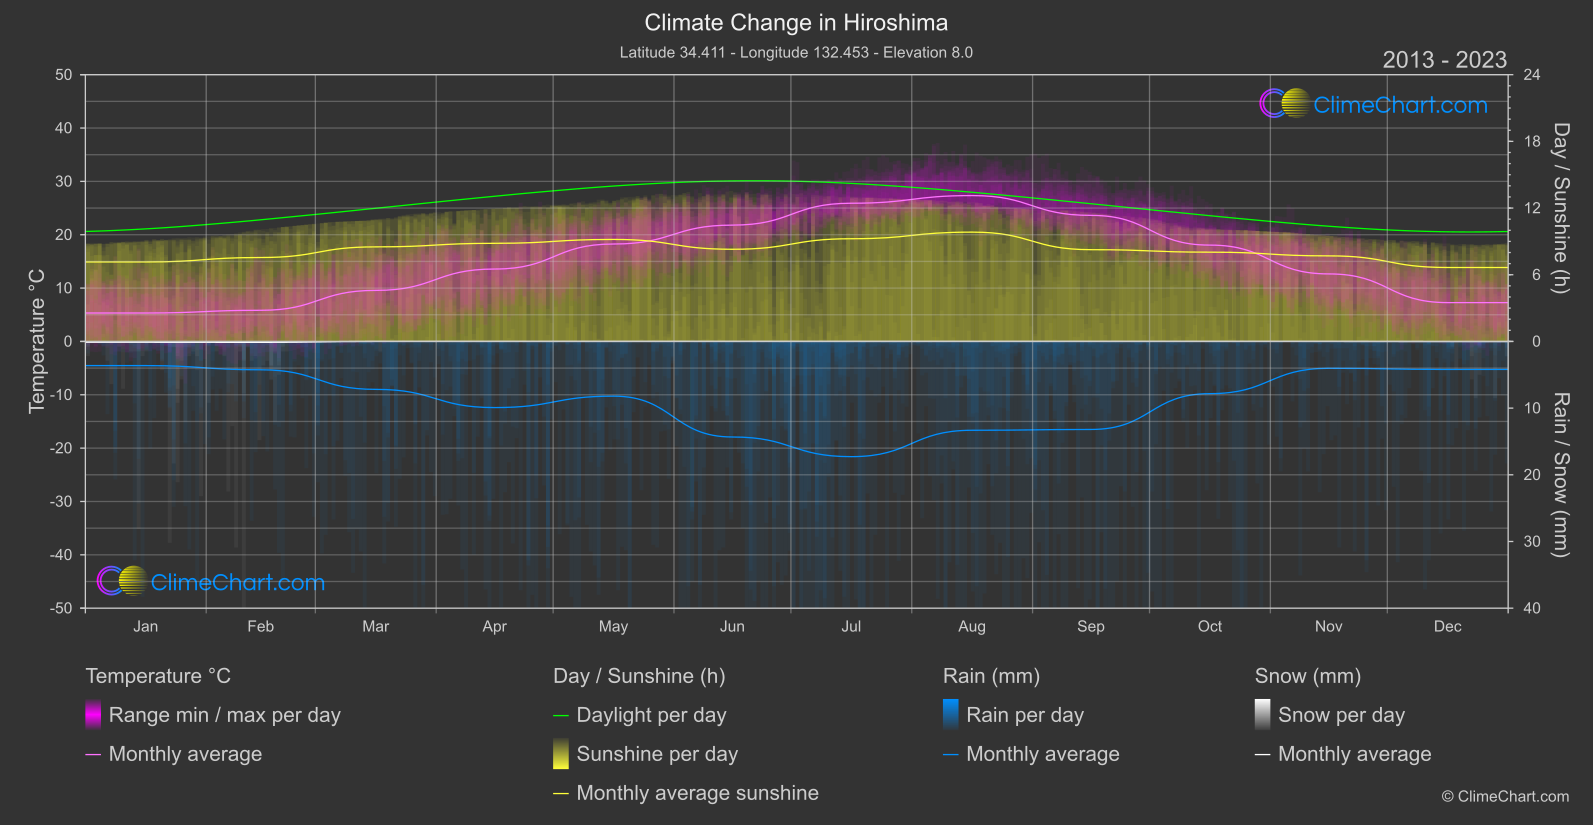
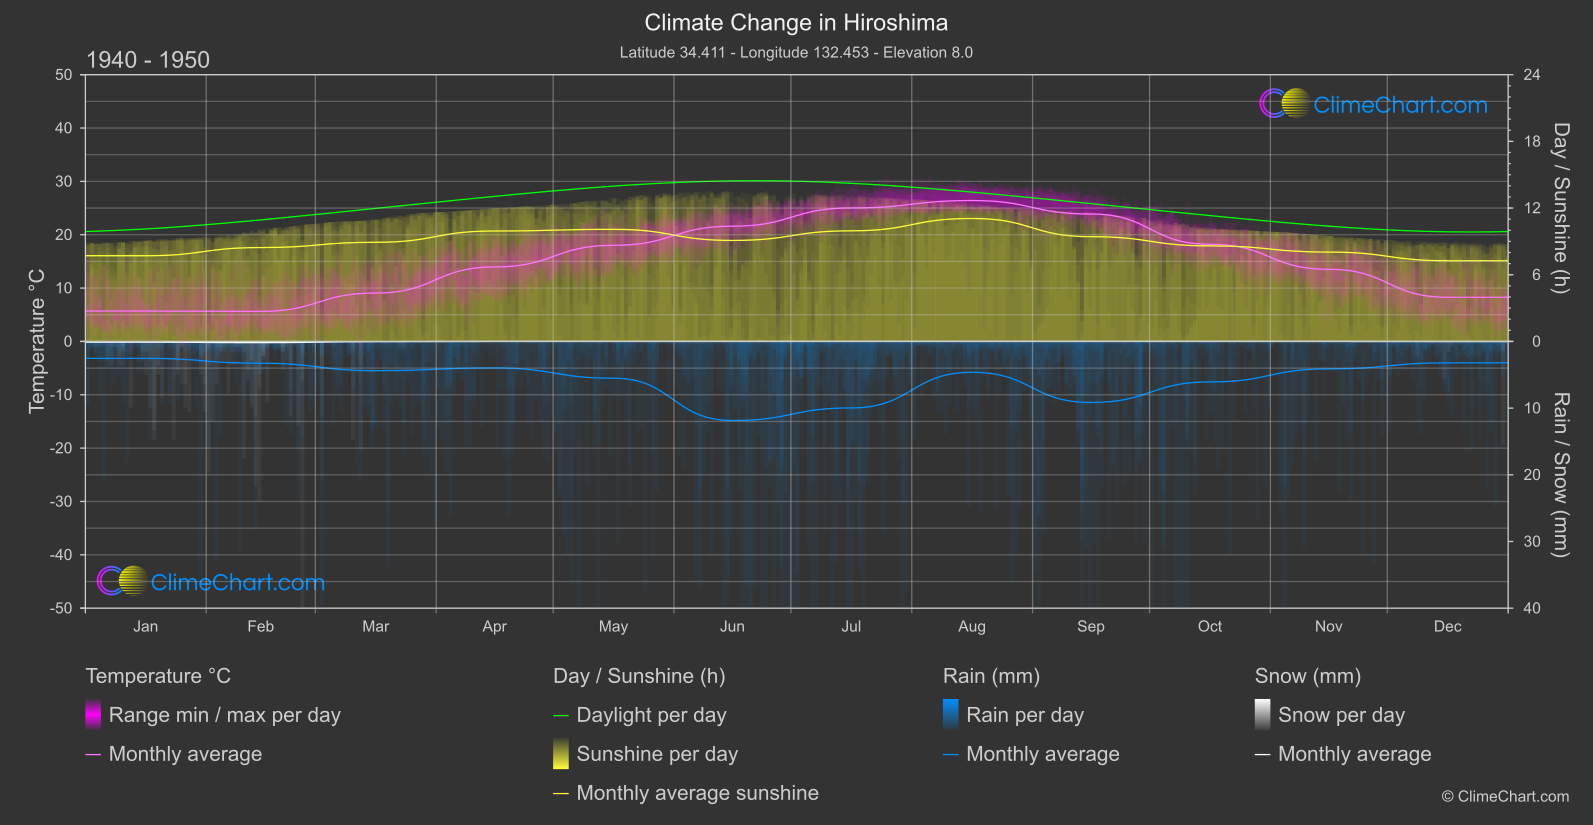
Hiroshima, Japan, has experienced notable changes in its climate over the years. The data comparison between 1940-1950 and 2013-2024 reveals interesting insights. For temperature, July shows the highest increase of 0.88°C, while for rainfall, August has the most significant rise of 4.35 mm. Snowfall remained minimal throughout the years, with December showing a slight increase. Sunshine duration saw a decrease in all months, with April experiencing the largest drop of 1.11 hours.
Climate Change Data Overview for Hiroshima, Japan
Explore the comprehensive climate change data for Hiroshima, Japan. This detailed table provides valuable insights into temperature variations, precipitation levels, and seasonal changes influenced by climate change, helping you understand the unique weather patterns of this region.
Temperature °C
| Month | ⌀ 1940 - 1950 | ⌀ 2013 - 2023 | +/- |
|---|---|---|---|
| Jan | 5.70 | 5.33 | -0.37 |
| Feb | 5.63 | 5.83 | 0.21 |
| Mar | 9.07 | 9.57 | 0.50 |
| Apr | 13.96 | 13.57 | -0.39 |
| May | 18.01 | 18.26 | 0.25 |
| Jun | 21.60 | 21.80 | 0.20 |
| Jul | 25.02 | 25.90 | 0.88 |
| Aug | 26.41 | 27.34 | 0.93 |
| Sep | 23.88 | 23.63 | -0.26 |
| Oct | 18.21 | 18.06 | -0.15 |
| Nov | 13.52 | 12.65 | -0.86 |
| Dec | 8.27 | 7.27 | -1.00 |
| ⌀ Month | 15.77 | 15.77 | -0.01 |
Sunshine (h)
| Month | ⌀ 1940 - 1950 | ⌀ 2013 - 2023 | +/- |
|---|---|---|---|
| Jan | 7.71 | 7.15 | -0.56 |
| Feb | 8.45 | 7.55 | -0.89 |
| Mar | 8.92 | 8.51 | -0.41 |
| Apr | 9.94 | 8.83 | -1.11 |
| May | 10.08 | 9.18 | -0.91 |
| Jun | 9.09 | 8.29 | -0.80 |
| Jul | 9.95 | 9.24 | -0.71 |
| Aug | 11.06 | 9.83 | -1.23 |
| Sep | 9.42 | 8.26 | -1.17 |
| Oct | 8.60 | 8.03 | -0.57 |
| Nov | 8.04 | 7.70 | -0.34 |
| Dec | 7.26 | 6.65 | -0.61 |
| ⌀ Month | 9.04 | 8.27 | -0.77 |
Rain (mm)
| Month | ⌀ 1940 - 1950 | ⌀ 2013 - 2023 | +/- |
|---|---|---|---|
| Jan | 1.27 | 1.81 | 0.54 |
| Feb | 1.63 | 2.13 | 0.49 |
| Mar | 2.19 | 3.59 | 1.40 |
| Apr | 1.99 | 4.96 | 2.97 |
| May | 2.76 | 4.10 | 1.35 |
| Jun | 5.93 | 7.17 | 1.24 |
| Jul | 4.99 | 8.64 | 3.65 |
| Aug | 2.31 | 6.66 | 4.35 |
| Sep | 4.58 | 6.60 | 2.02 |
| Oct | 3.04 | 3.92 | 0.88 |
| Nov | 2.06 | 2.01 | -0.04 |
| Dec | 1.60 | 2.10 | 0.50 |
| ⌀ Month | 2.86 | 4.47 | 1.61 |
Snow (mm)
| Month | ⌀ 1940 - 1950 | ⌀ 2013 - 2023 | +/- |
|---|---|---|---|
| Jan | 0.05 | 0.06 | 0.01 |
| Feb | 0.09 | 0.07 | -0.02 |
| Mar | 0.02 | 0.00 | -0.01 |
| Apr | 0.00 | 0.00 | 0.00 |
| May | 0.00 | 0.00 | 0.00 |
| Jun | 0.00 | 0.00 | 0.00 |
| Jul | 0.00 | 0.00 | 0.00 |
| Aug | 0.00 | 0.00 | 0.00 |
| Sep | 0.00 | 0.00 | 0.00 |
| Oct | 0.00 | 0.00 | 0.00 |
| Nov | 0.00 | 0.00 | 0.00 |
| Dec | 0.01 | 0.01 | 0.00 |
| ⌀ Month | 0.01 | 0.01 | -0.00 |