Climate Change Chart of Helena, USA
Comprehensive Climate Change Chart of Helena, USA: Monthly Averages and Impact Trends
Exploring the changing climate in Helena, USA reveals intriguing insights into temperature, rainfall, snowfall, and sunshine duration.
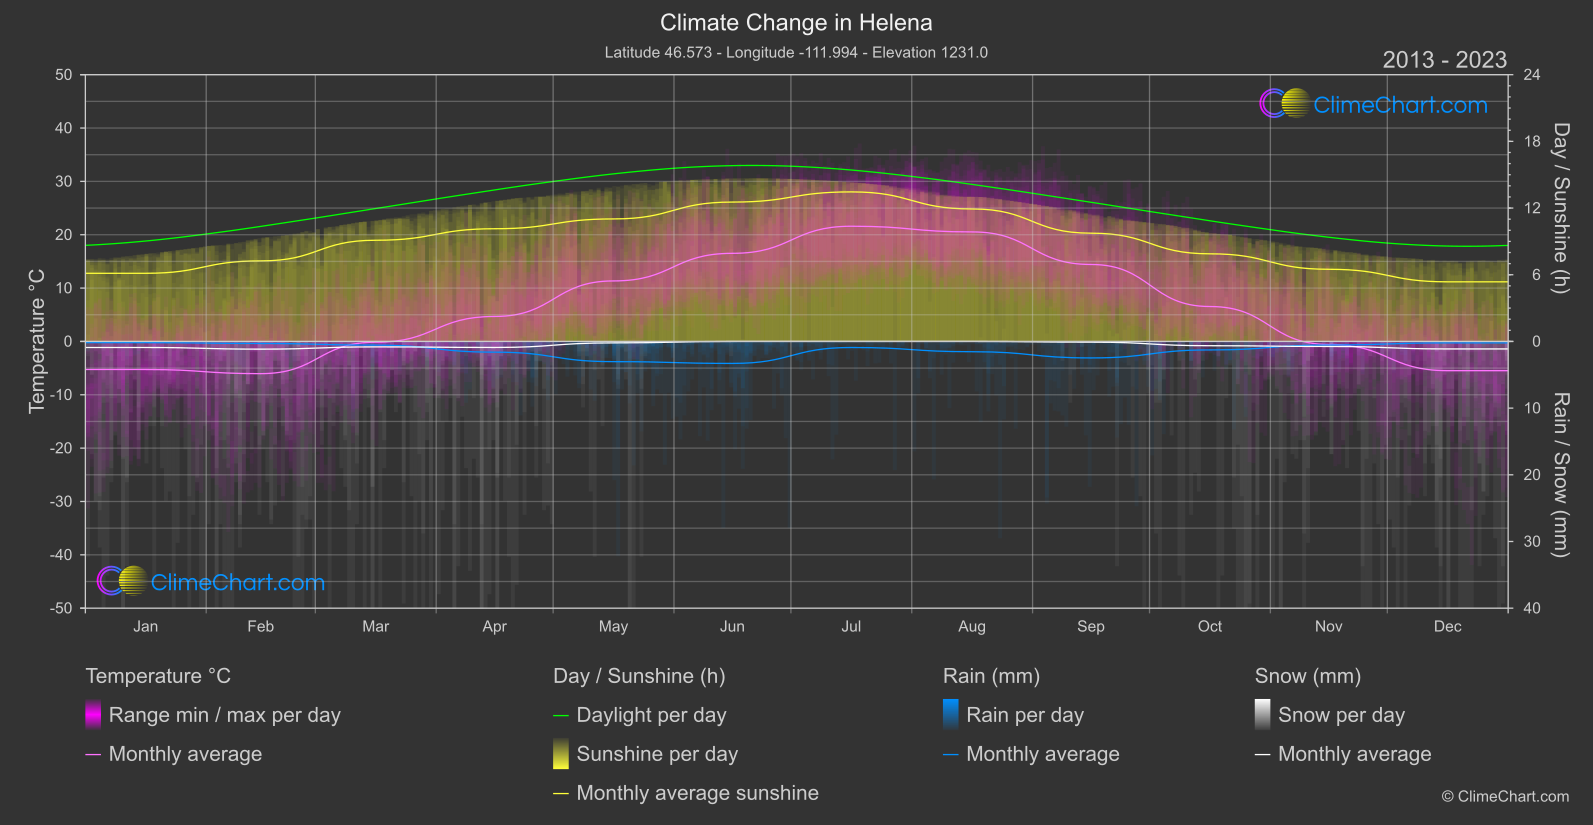
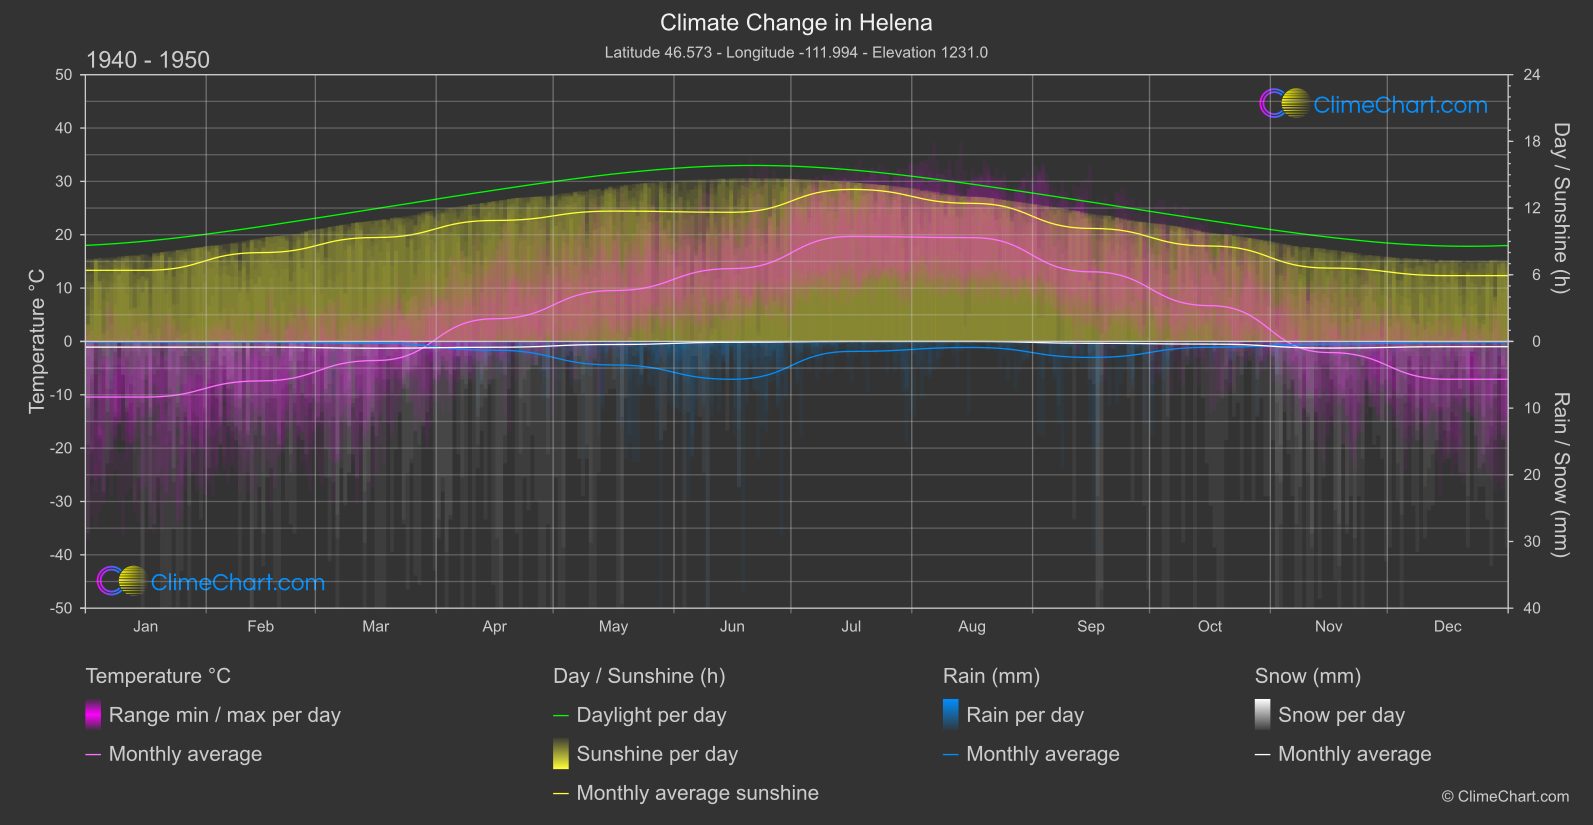
Helena, USA has experienced notable changes in climate over the years. From January to December, the temperature, rainfall, snowfall, and sunshine duration have all exhibited varying patterns. Notably, June shows the highest temperature change of 2.86°C, while October experiences a decrease in temperature by 0.16°C. When it comes to rainfall, October has the highest increase of 0.20mm, and June sees the most significant decrease of 1.19mm. Snowfall remains relatively stable throughout the year, with December showing the highest increase of 0.17mm. Sunshine duration fluctuates, with June having the most significant increase of 0.92 hours and December experiencing the largest decrease of 0.56 hours.
Climate Change Data Overview for Helena, USA
Explore the comprehensive climate change data for Helena, USA. This detailed table provides valuable insights into temperature variations, precipitation levels, and seasonal changes influenced by climate change, helping you understand the unique weather patterns of this region.
Temperature °C
| Month | ⌀ 1940 - 1950 | ⌀ 2013 - 2023 | +/- |
|---|---|---|---|
| Jan | -10.42 | -5.26 | 5.16 |
| Feb | -7.40 | -6.04 | 1.36 |
| Mar | -3.58 | -0.15 | 3.43 |
| Apr | 4.25 | 4.68 | 0.43 |
| May | 9.53 | 11.34 | 1.81 |
| Jun | 13.66 | 16.51 | 2.86 |
| Jul | 19.68 | 21.59 | 1.91 |
| Aug | 19.45 | 20.53 | 1.07 |
| Sep | 13.05 | 14.43 | 1.37 |
| Oct | 6.71 | 6.55 | -0.16 |
| Nov | -2.08 | -0.56 | 1.52 |
| Dec | -7.09 | -5.48 | 1.60 |
| ⌀ Month | 4.65 | 6.51 | 1.86 |
Sunshine (h)
| Month | ⌀ 1940 - 1950 | ⌀ 2013 - 2023 | +/- |
|---|---|---|---|
| Jan | 6.40 | 6.13 | -0.27 |
| Feb | 7.99 | 7.25 | -0.74 |
| Mar | 9.35 | 9.10 | -0.25 |
| Apr | 10.88 | 10.14 | -0.75 |
| May | 11.73 | 11.02 | -0.70 |
| Jun | 11.62 | 12.54 | 0.92 |
| Jul | 13.68 | 13.45 | -0.23 |
| Aug | 12.42 | 11.92 | -0.51 |
| Sep | 10.17 | 9.74 | -0.43 |
| Oct | 8.59 | 7.88 | -0.70 |
| Nov | 6.60 | 6.49 | -0.11 |
| Dec | 5.92 | 5.36 | -0.56 |
| ⌀ Month | 9.61 | 9.25 | -0.36 |
Rain (mm)
| Month | ⌀ 1940 - 1950 | ⌀ 2013 - 2023 | +/- |
|---|---|---|---|
| Jan | 0.06 | 0.09 | 0.03 |
| Feb | 0.05 | 0.15 | 0.10 |
| Mar | 0.14 | 0.28 | 0.14 |
| Apr | 0.66 | 0.80 | 0.15 |
| May | 1.76 | 1.52 | -0.25 |
| Jun | 2.84 | 1.65 | -1.19 |
| Jul | 0.75 | 0.46 | -0.29 |
| Aug | 0.45 | 0.77 | 0.32 |
| Sep | 1.20 | 1.24 | 0.04 |
| Oct | 0.44 | 0.64 | 0.20 |
| Nov | 0.20 | 0.27 | 0.07 |
| Dec | 0.07 | 0.11 | 0.04 |
| ⌀ Month | 0.72 | 0.66 | -0.05 |
Snow (mm)
| Month | ⌀ 1940 - 1950 | ⌀ 2013 - 2023 | +/- |
|---|---|---|---|
| Jan | 0.43 | 0.45 | 0.03 |
| Feb | 0.42 | 0.58 | 0.15 |
| Mar | 0.51 | 0.41 | -0.10 |
| Apr | 0.44 | 0.45 | 0.01 |
| May | 0.23 | 0.11 | -0.12 |
| Jun | 0.06 | 0.00 | -0.06 |
| Jul | 0.00 | 0.00 | 0.00 |
| Aug | 0.00 | 0.00 | 0.00 |
| Sep | 0.14 | 0.05 | -0.08 |
| Oct | 0.20 | 0.32 | 0.12 |
| Nov | 0.50 | 0.38 | -0.12 |
| Dec | 0.39 | 0.56 | 0.17 |
| ⌀ Month | 0.28 | 0.28 | 0.00 |