Climate Change Chart of Heavenly, USA
Comprehensive Climate Change Chart of Heavenly, USA: Monthly Averages and Impact Trends
Discover how the climate in Heavenly, United States of America has changed over the years with insights into temperature, rainfall, snowfall, and sunshine duration.
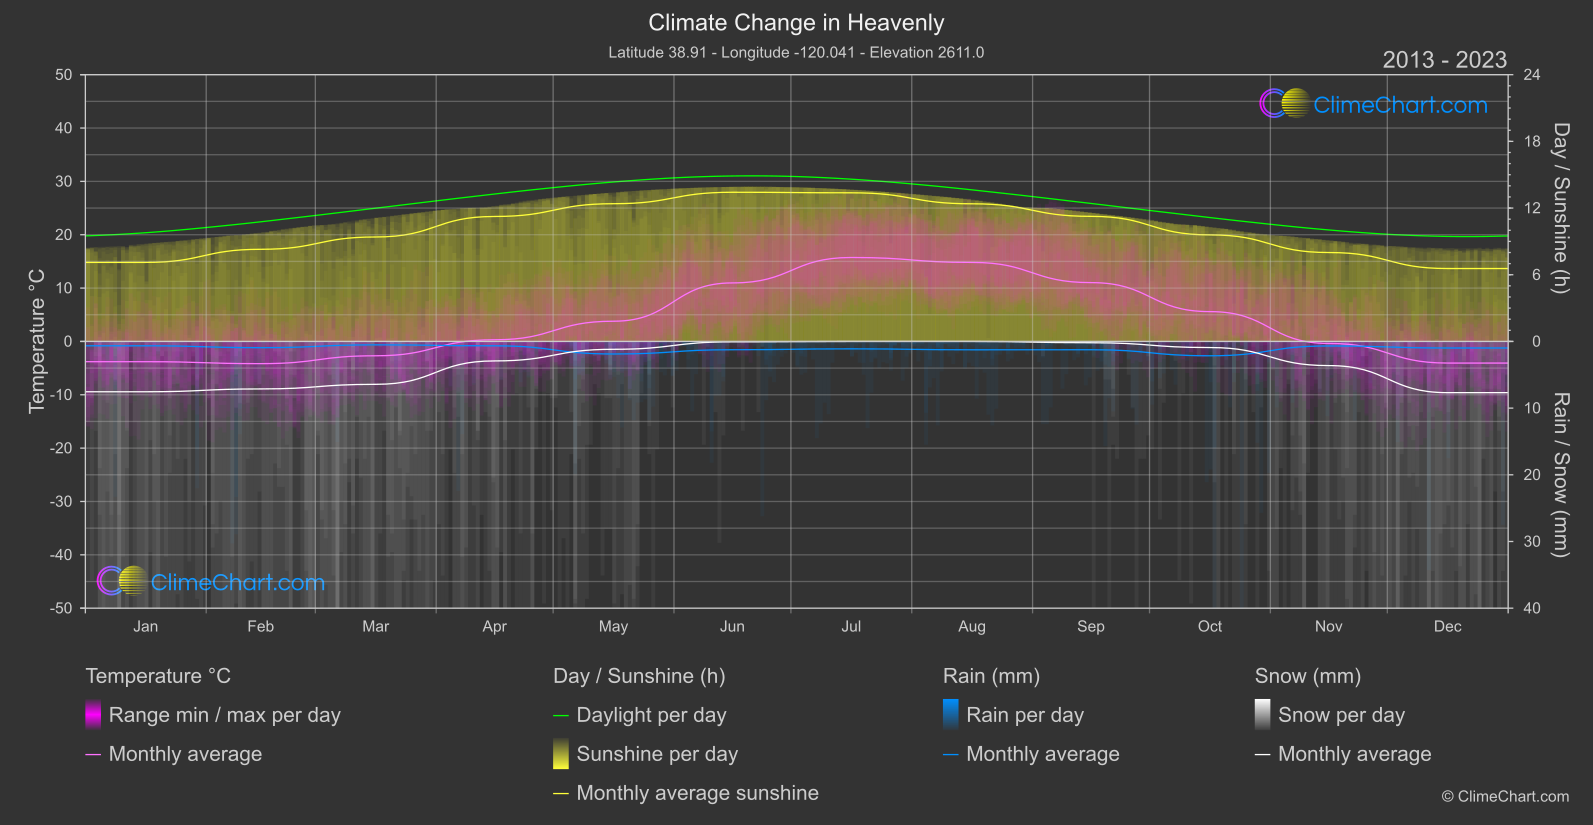
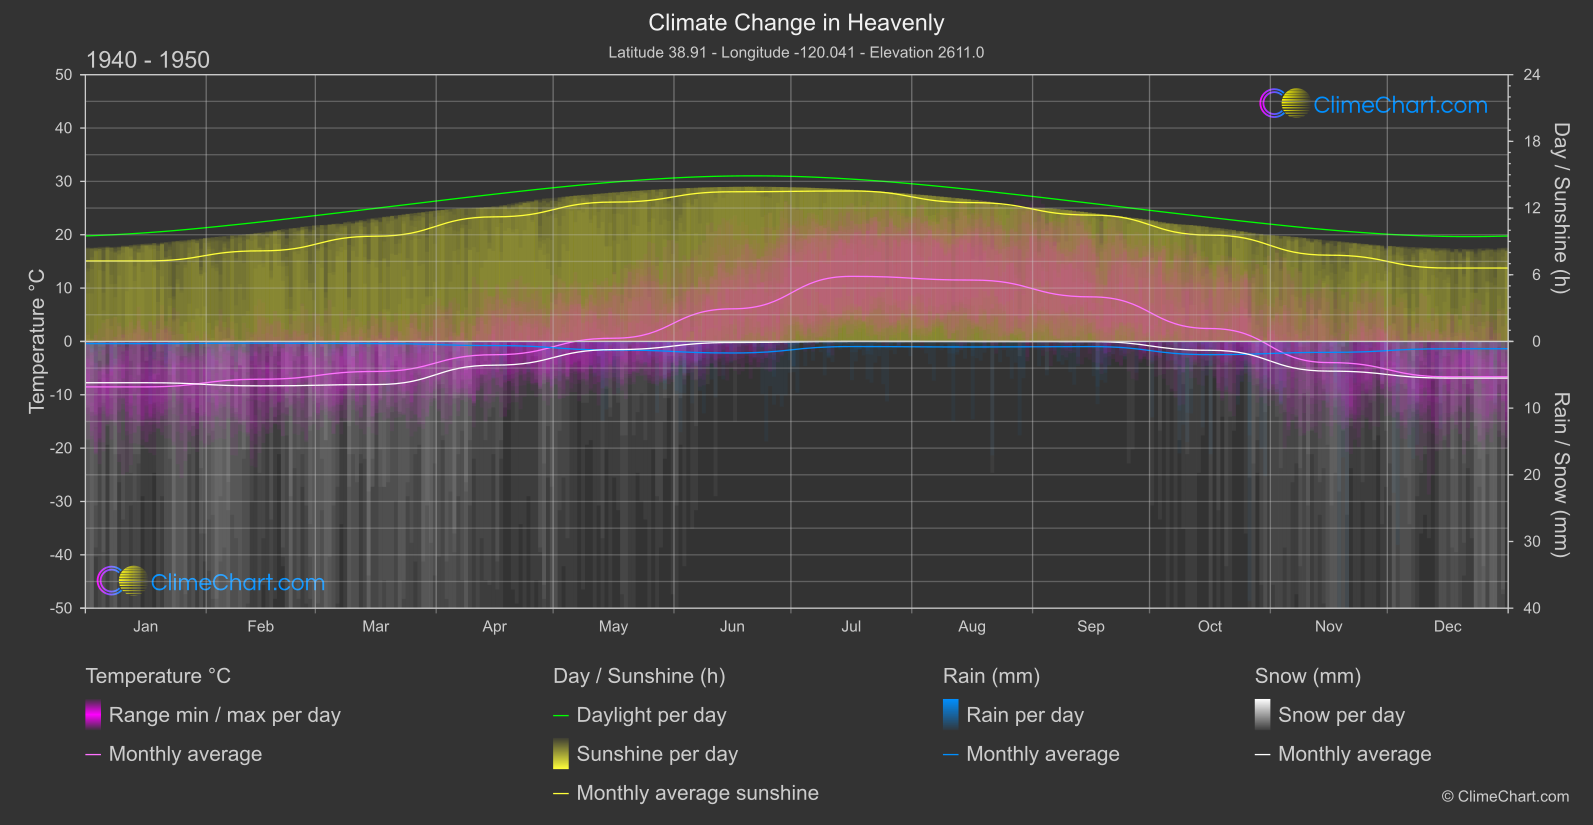
Heavenly, located in the United States of America, has experienced significant changes in climate over the years. From the data provided, it is evident that June has seen the highest increase in temperature, with a change of 4.86°C between the periods of 1940-1950 and 2013-2024. In terms of rainfall, November has shown the most notable decrease, with a change of -0.48 mm. Snowfall has varied across the months, with December experiencing the most significant increase of 1.09 mm. Additionally, the duration of sunshine has fluctuated, with November showing the highest increase in hours of sunshine at 0.24 hours.
Climate Change Data Overview for Heavenly, USA
Explore the comprehensive climate change data for Heavenly, USA. This detailed table provides valuable insights into temperature variations, precipitation levels, and seasonal changes influenced by climate change, helping you understand the unique weather patterns of this region.
Temperature °C
| Month | ⌀ 1940 - 1950 | ⌀ 2013 - 2023 | +/- |
|---|---|---|---|
| Jan | -8.52 | -3.80 | 4.72 |
| Feb | -7.08 | -4.16 | 2.92 |
| Mar | -5.63 | -2.69 | 2.94 |
| Apr | -2.49 | 0.31 | 2.81 |
| May | 0.60 | 3.79 | 3.19 |
| Jun | 6.11 | 10.97 | 4.86 |
| Jul | 12.20 | 15.74 | 3.54 |
| Aug | 11.50 | 14.81 | 3.31 |
| Sep | 8.35 | 11.02 | 2.67 |
| Oct | 2.42 | 5.59 | 3.17 |
| Nov | -3.96 | -0.38 | 3.58 |
| Dec | -6.62 | -4.05 | 2.57 |
| ⌀ Month | 0.57 | 3.93 | 3.36 |
Sunshine (h)
| Month | ⌀ 1940 - 1950 | ⌀ 2013 - 2023 | +/- |
|---|---|---|---|
| Jan | 7.24 | 7.11 | -0.13 |
| Feb | 8.15 | 8.29 | 0.14 |
| Mar | 9.47 | 9.40 | -0.07 |
| Apr | 11.21 | 11.24 | 0.03 |
| May | 12.54 | 12.39 | -0.15 |
| Jun | 13.47 | 13.42 | -0.05 |
| Jul | 13.54 | 13.37 | -0.16 |
| Aug | 12.49 | 12.38 | -0.11 |
| Sep | 11.37 | 11.25 | -0.12 |
| Oct | 9.57 | 9.59 | 0.02 |
| Nov | 7.76 | 8.00 | 0.24 |
| Dec | 6.60 | 6.56 | -0.05 |
| ⌀ Month | 10.28 | 10.25 | -0.03 |
Rain (mm)
| Month | ⌀ 1940 - 1950 | ⌀ 2013 - 2023 | +/- |
|---|---|---|---|
| Jan | 0.16 | 0.33 | 0.16 |
| Feb | 0.13 | 0.47 | 0.34 |
| Mar | 0.16 | 0.26 | 0.10 |
| Apr | 0.31 | 0.33 | 0.02 |
| May | 0.64 | 0.94 | 0.30 |
| Jun | 0.87 | 0.62 | -0.24 |
| Jul | 0.38 | 0.56 | 0.17 |
| Aug | 0.42 | 0.63 | 0.21 |
| Sep | 0.39 | 0.62 | 0.24 |
| Oct | 0.99 | 1.08 | 0.08 |
| Nov | 0.82 | 0.34 | -0.48 |
| Dec | 0.55 | 0.49 | -0.06 |
| ⌀ Month | 0.48 | 0.55 | 0.07 |
Snow (mm)
| Month | ⌀ 1940 - 1950 | ⌀ 2013 - 2023 | +/- |
|---|---|---|---|
| Jan | 3.10 | 3.77 | 0.68 |
| Feb | 3.33 | 3.56 | 0.23 |
| Mar | 3.23 | 3.22 | -0.02 |
| Apr | 1.78 | 1.46 | -0.32 |
| May | 0.61 | 0.59 | -0.02 |
| Jun | 0.08 | 0.03 | -0.05 |
| Jul | 0.00 | 0.00 | 0.00 |
| Aug | 0.01 | 0.00 | -0.01 |
| Sep | 0.01 | 0.10 | 0.09 |
| Oct | 0.66 | 0.46 | -0.20 |
| Nov | 2.23 | 1.81 | -0.41 |
| Dec | 2.75 | 3.84 | 1.09 |
| ⌀ Month | 1.48 | 1.57 | 0.09 |