Climate Change Chart of Hawaii Big Island, USA
Comprehensive Climate Change Chart of Hawaii Big Island, USA: Monthly Averages and Impact Trends
Explore the changing climate of Hawaii Big Island, USA, through insightful data analysis. Discover how temperatures, rainfall, snowfall, and sunshine duration have evolved from 1940-1950 to 2013-2024.
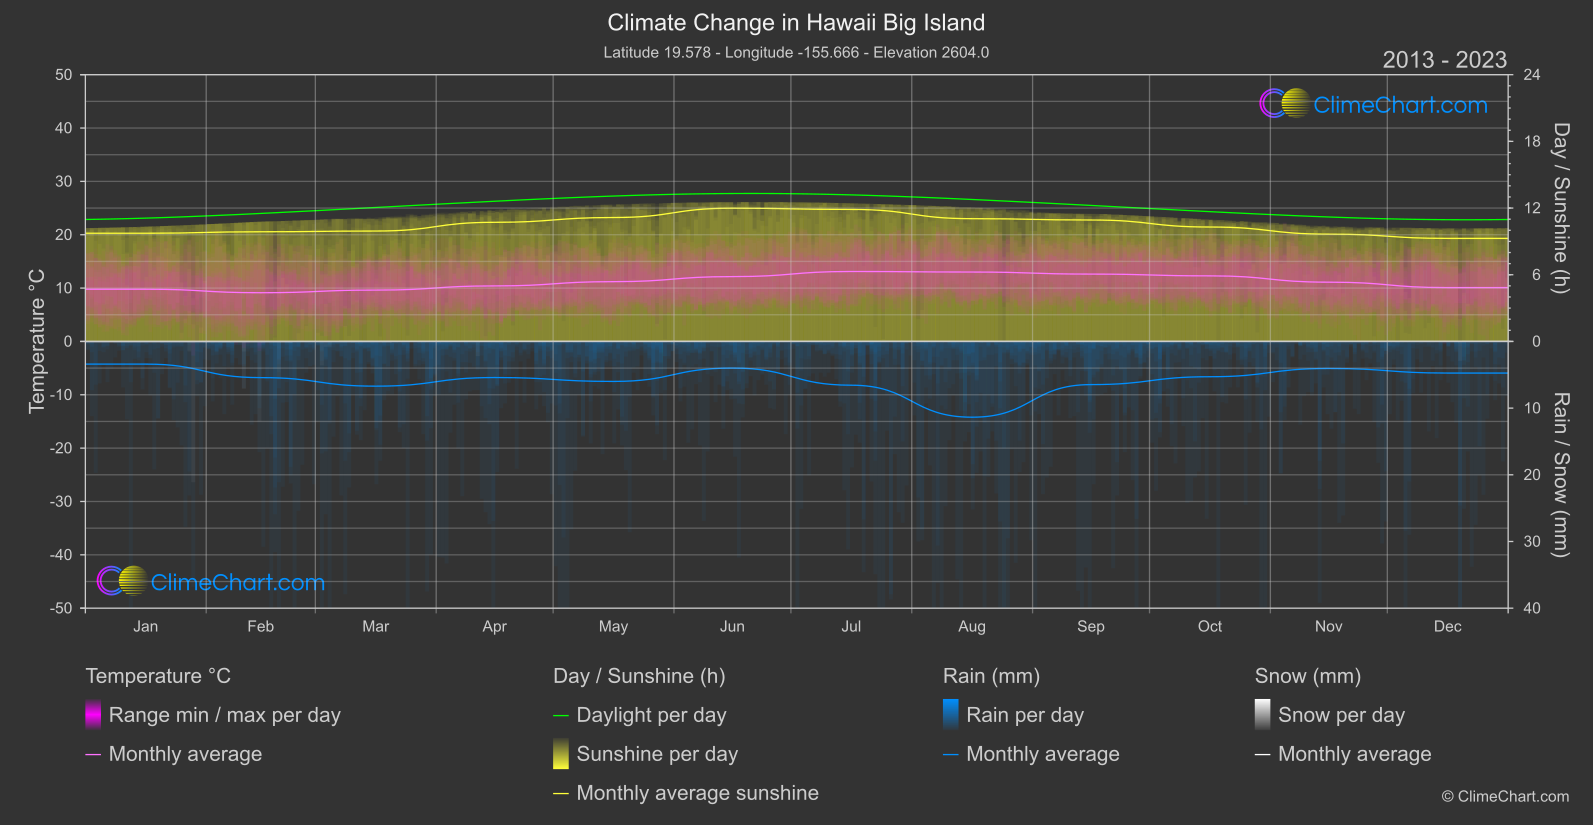
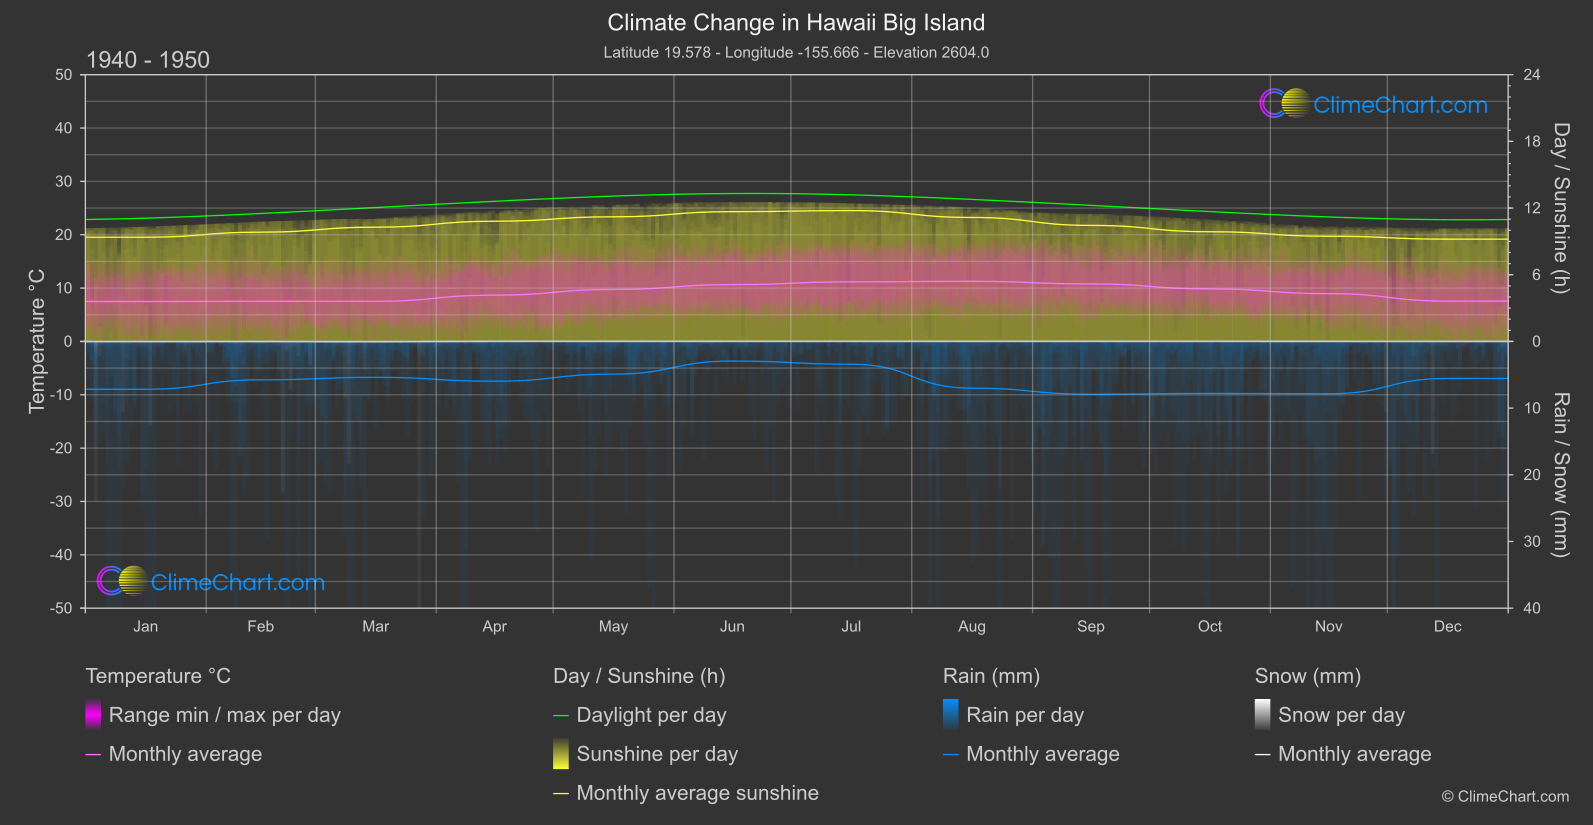
The climate of Hawaii Big Island has experienced significant changes over the years. Analysis of the temperature data from 1940-1950 to 2013-2024 reveals an overall increase in temperatures across all months. The month with the highest temperature change is December, with a substantial 2.53°C increase. In terms of rainfall, there are fluctuations in the amount of precipitation, with notable changes in August and July. Snowfall, on the other hand, shows minimal changes over the years. Sunshine duration displays varying trends, with some months experiencing an increase while others show a decrease in sunlight.
Climate Change Data Overview for Hawaii Big Island, USA
Explore the comprehensive climate change data for Hawaii Big Island, USA. This detailed table provides valuable insights into temperature variations, precipitation levels, and seasonal changes influenced by climate change, helping you understand the unique weather patterns of this region.
Temperature °C
| Month | ⌀ 1940 - 1950 | ⌀ 2013 - 2023 | +/- |
|---|---|---|---|
| Jan | 7.48 | 9.79 | 2.31 |
| Feb | 7.53 | 9.13 | 1.60 |
| Mar | 7.52 | 9.62 | 2.10 |
| Apr | 8.68 | 10.41 | 1.73 |
| May | 9.74 | 11.20 | 1.46 |
| Jun | 10.65 | 12.15 | 1.50 |
| Jul | 11.16 | 13.11 | 1.95 |
| Aug | 11.27 | 13.01 | 1.74 |
| Sep | 10.78 | 12.62 | 1.85 |
| Oct | 9.85 | 12.29 | 2.44 |
| Nov | 8.95 | 11.11 | 2.15 |
| Dec | 7.56 | 10.09 | 2.53 |
| ⌀ Month | 9.26 | 11.21 | 1.95 |
Sunshine (h)
| Month | ⌀ 1940 - 1950 | ⌀ 2013 - 2023 | +/- |
|---|---|---|---|
| Jan | 9.38 | 9.73 | 0.36 |
| Feb | 9.83 | 9.87 | 0.04 |
| Mar | 10.28 | 9.93 | -0.35 |
| Apr | 10.82 | 10.72 | -0.10 |
| May | 11.21 | 11.15 | -0.06 |
| Jun | 11.68 | 11.99 | 0.31 |
| Jul | 11.77 | 11.88 | 0.10 |
| Aug | 11.15 | 11.04 | -0.11 |
| Sep | 10.44 | 10.92 | 0.49 |
| Oct | 9.87 | 10.29 | 0.42 |
| Nov | 9.46 | 9.65 | 0.19 |
| Dec | 9.20 | 9.27 | 0.07 |
| ⌀ Month | 10.42 | 10.54 | 0.11 |
Rain (mm)
| Month | ⌀ 1940 - 1950 | ⌀ 2013 - 2023 | +/- |
|---|---|---|---|
| Jan | 3.59 | 1.70 | -1.89 |
| Feb | 2.88 | 2.71 | -0.17 |
| Mar | 2.69 | 3.35 | 0.66 |
| Apr | 2.98 | 2.71 | -0.27 |
| May | 2.45 | 3.00 | 0.55 |
| Jun | 1.47 | 2.00 | 0.53 |
| Jul | 1.71 | 3.28 | 1.57 |
| Aug | 3.50 | 5.68 | 2.18 |
| Sep | 3.96 | 3.24 | -0.72 |
| Oct | 3.90 | 2.65 | -1.25 |
| Nov | 3.92 | 2.03 | -1.89 |
| Dec | 2.77 | 2.37 | -0.40 |
| ⌀ Month | 2.99 | 2.89 | -0.09 |
Snow (mm)
| Month | ⌀ 1940 - 1950 | ⌀ 2013 - 2023 | +/- |
|---|---|---|---|
| Jan | 0.02 | 0.01 | -0.01 |
| Feb | 0.01 | 0.01 | -0.00 |
| Mar | 0.02 | 0.00 | -0.02 |
| Apr | 0.00 | 0.00 | 0.00 |
| May | 0.00 | 0.00 | 0.00 |
| Jun | 0.00 | 0.00 | 0.00 |
| Jul | 0.00 | 0.00 | 0.00 |
| Aug | 0.00 | 0.00 | 0.00 |
| Sep | 0.00 | 0.00 | 0.00 |
| Oct | 0.00 | 0.00 | 0.00 |
| Nov | 0.00 | 0.00 | -0.00 |
| Dec | 0.01 | 0.00 | -0.00 |
| ⌀ Month | 0.00 | 0.00 | -0.00 |