Climate Change Chart of Hartford, USA
Comprehensive Climate Change Chart of Hartford, USA: Monthly Averages and Impact Trends
Exploring the climate changes in Hartford, USA reveals intriguing insights about temperature, rainfall, snowfall, and sunshine duration over the years.
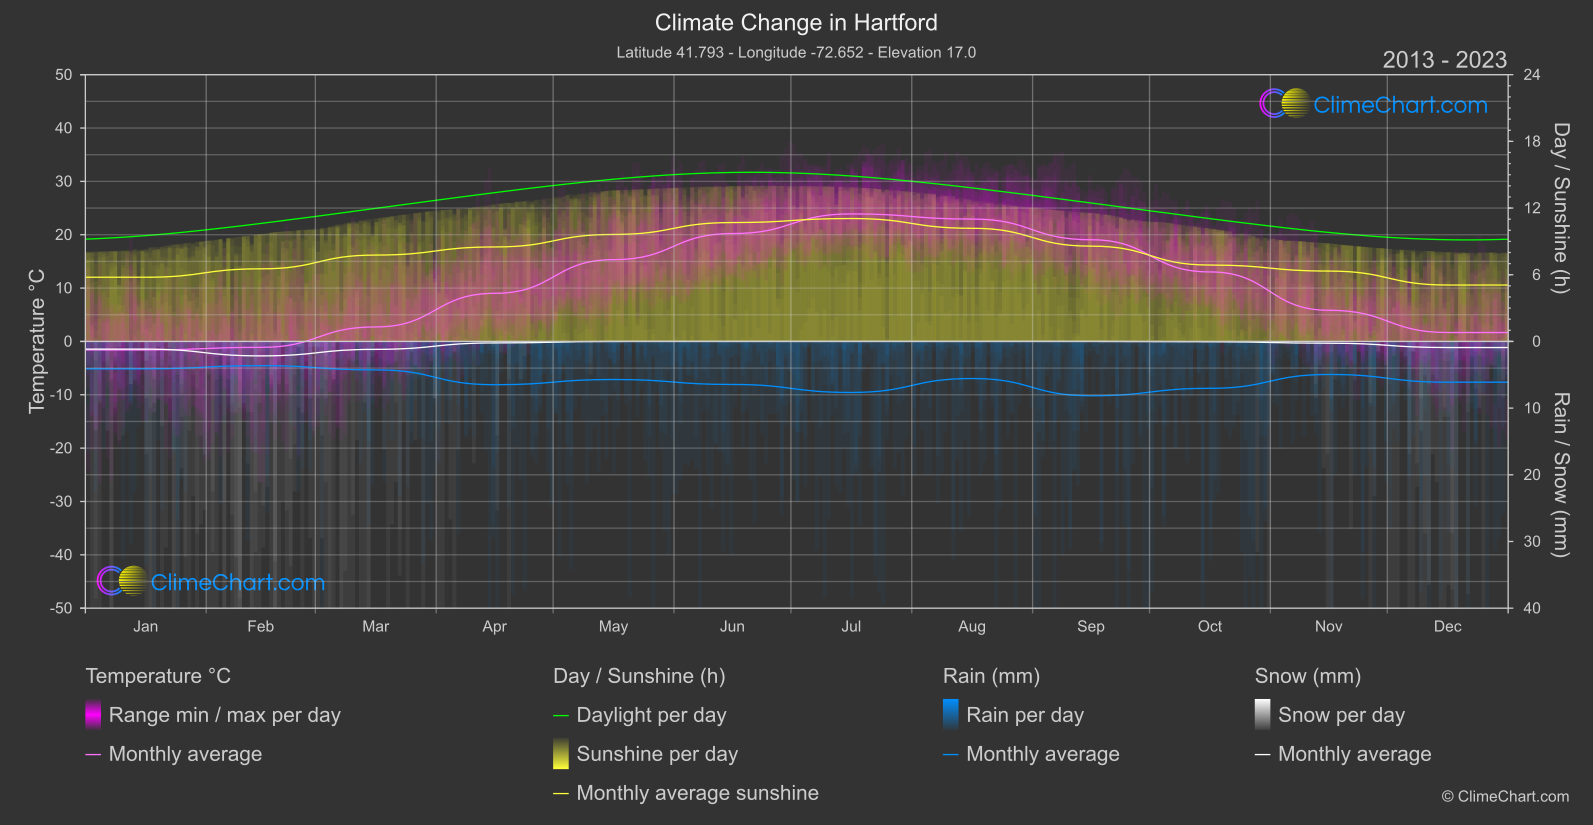
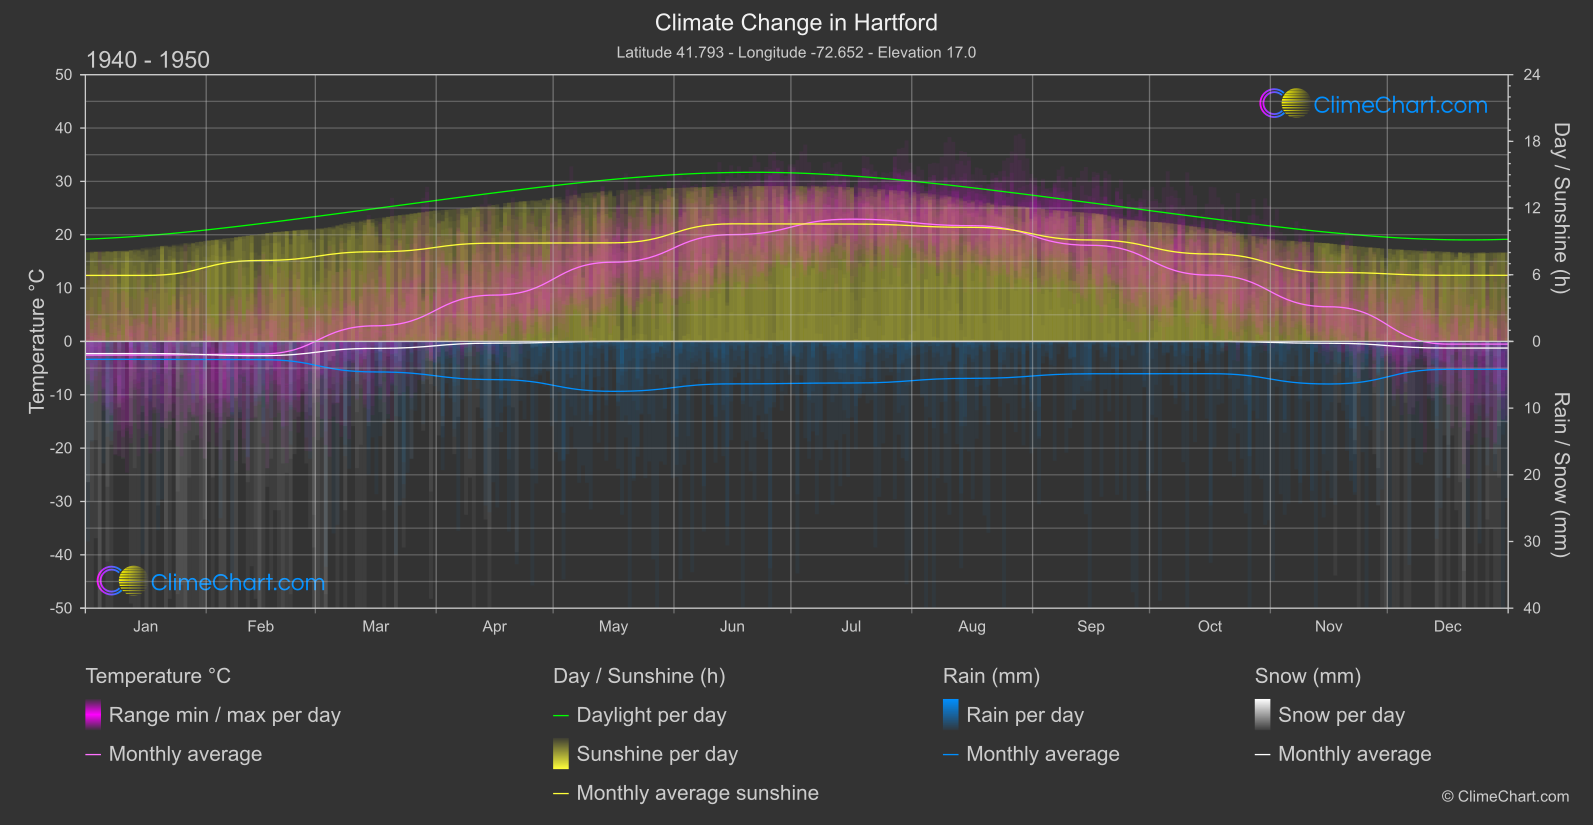
The data showcases how temperatures have increased over the years, with August experiencing the highest temperature change. In terms of rainfall, September has seen a significant rise in mm compared to the past. Snowfall has notably decreased, with December having the most substantial drop. Moreover, sunshine duration has shown variations, with May having a significant increase in hours of sunshine.
Climate Change Data Overview for Hartford, USA
Explore the comprehensive climate change data for Hartford, USA. This detailed table provides valuable insights into temperature variations, precipitation levels, and seasonal changes influenced by climate change, helping you understand the unique weather patterns of this region.
Temperature °C
| Month | ⌀ 1940 - 1950 | ⌀ 2013 - 2023 | +/- |
|---|---|---|---|
| Jan | -2.56 | -1.59 | 0.97 |
| Feb | -2.35 | -1.11 | 1.25 |
| Mar | 2.93 | 2.72 | -0.21 |
| Apr | 8.68 | 9.02 | 0.33 |
| May | 14.86 | 15.33 | 0.47 |
| Jun | 20.02 | 20.22 | 0.20 |
| Jul | 22.92 | 23.91 | 0.99 |
| Aug | 21.70 | 22.93 | 1.24 |
| Sep | 18.02 | 19.06 | 1.04 |
| Oct | 12.43 | 13.03 | 0.60 |
| Nov | 6.50 | 5.84 | -0.66 |
| Dec | -0.50 | 1.67 | 2.17 |
| ⌀ Month | 10.22 | 10.92 | 0.70 |
Sunshine (h)
| Month | ⌀ 1940 - 1950 | ⌀ 2013 - 2023 | +/- |
|---|---|---|---|
| Jan | 5.94 | 5.77 | -0.17 |
| Feb | 7.29 | 6.53 | -0.75 |
| Mar | 8.07 | 7.77 | -0.30 |
| Apr | 8.84 | 8.50 | -0.34 |
| May | 8.87 | 9.63 | 0.76 |
| Jun | 10.58 | 10.70 | 0.11 |
| Jul | 10.56 | 11.06 | 0.50 |
| Aug | 10.26 | 10.18 | -0.09 |
| Sep | 9.13 | 8.57 | -0.55 |
| Oct | 7.87 | 6.87 | -0.99 |
| Nov | 6.21 | 6.33 | 0.13 |
| Dec | 5.95 | 5.08 | -0.87 |
| ⌀ Month | 8.30 | 8.08 | -0.22 |
Rain (mm)
| Month | ⌀ 1940 - 1950 | ⌀ 2013 - 2023 | +/- |
|---|---|---|---|
| Jan | 1.34 | 2.05 | 0.71 |
| Feb | 1.36 | 1.82 | 0.45 |
| Mar | 2.29 | 2.13 | -0.15 |
| Apr | 2.86 | 3.25 | 0.38 |
| May | 3.74 | 2.85 | -0.89 |
| Jun | 3.18 | 3.23 | 0.05 |
| Jul | 3.12 | 3.83 | 0.71 |
| Aug | 2.77 | 2.78 | 0.01 |
| Sep | 2.43 | 4.07 | 1.65 |
| Oct | 2.42 | 3.52 | 1.10 |
| Nov | 3.19 | 2.48 | -0.71 |
| Dec | 2.09 | 3.06 | 0.97 |
| ⌀ Month | 2.57 | 2.92 | 0.36 |
Snow (mm)
| Month | ⌀ 1940 - 1950 | ⌀ 2013 - 2023 | +/- |
|---|---|---|---|
| Jan | 0.91 | 0.58 | -0.34 |
| Feb | 1.06 | 1.08 | 0.02 |
| Mar | 0.52 | 0.59 | 0.07 |
| Apr | 0.13 | 0.11 | -0.02 |
| May | 0.00 | 0.00 | 0.00 |
| Jun | 0.00 | 0.00 | 0.00 |
| Jul | 0.00 | 0.00 | 0.00 |
| Aug | 0.00 | 0.00 | 0.00 |
| Sep | 0.00 | 0.00 | 0.00 |
| Oct | 0.00 | 0.02 | 0.02 |
| Nov | 0.14 | 0.13 | -0.00 |
| Dec | 0.50 | 0.46 | -0.04 |
| ⌀ Month | 0.27 | 0.25 | -0.02 |