Climate Change Chart of Harrisburg, USA
Comprehensive Climate Change Chart of Harrisburg, USA: Monthly Averages and Impact Trends
Exploring the changing climate in Harrisburg, USA reveals intriguing insights into temperature, rainfall, snowfall, and sunshine duration trends over the years.
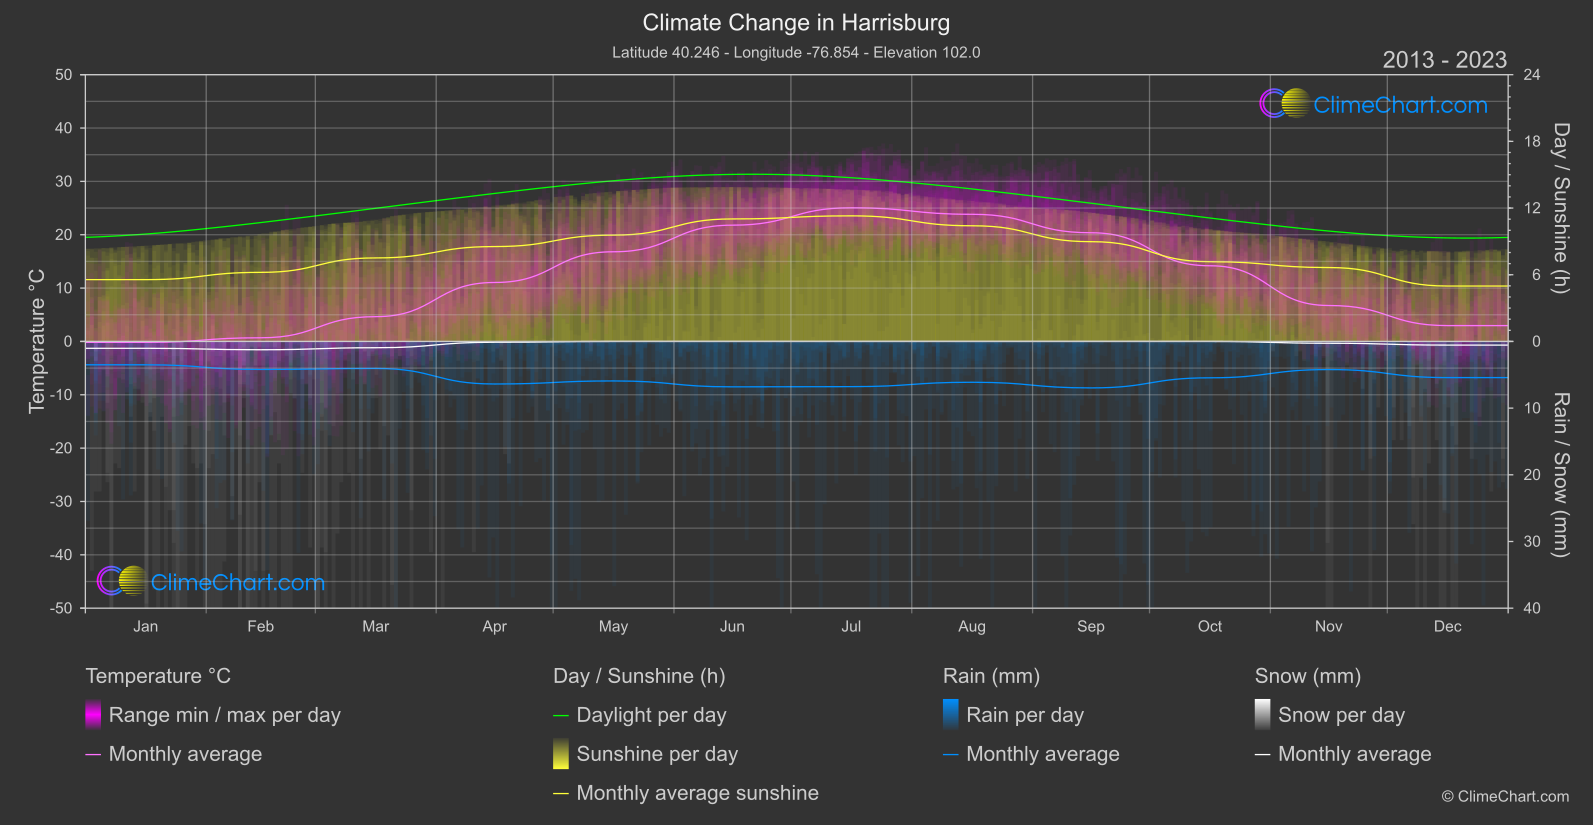
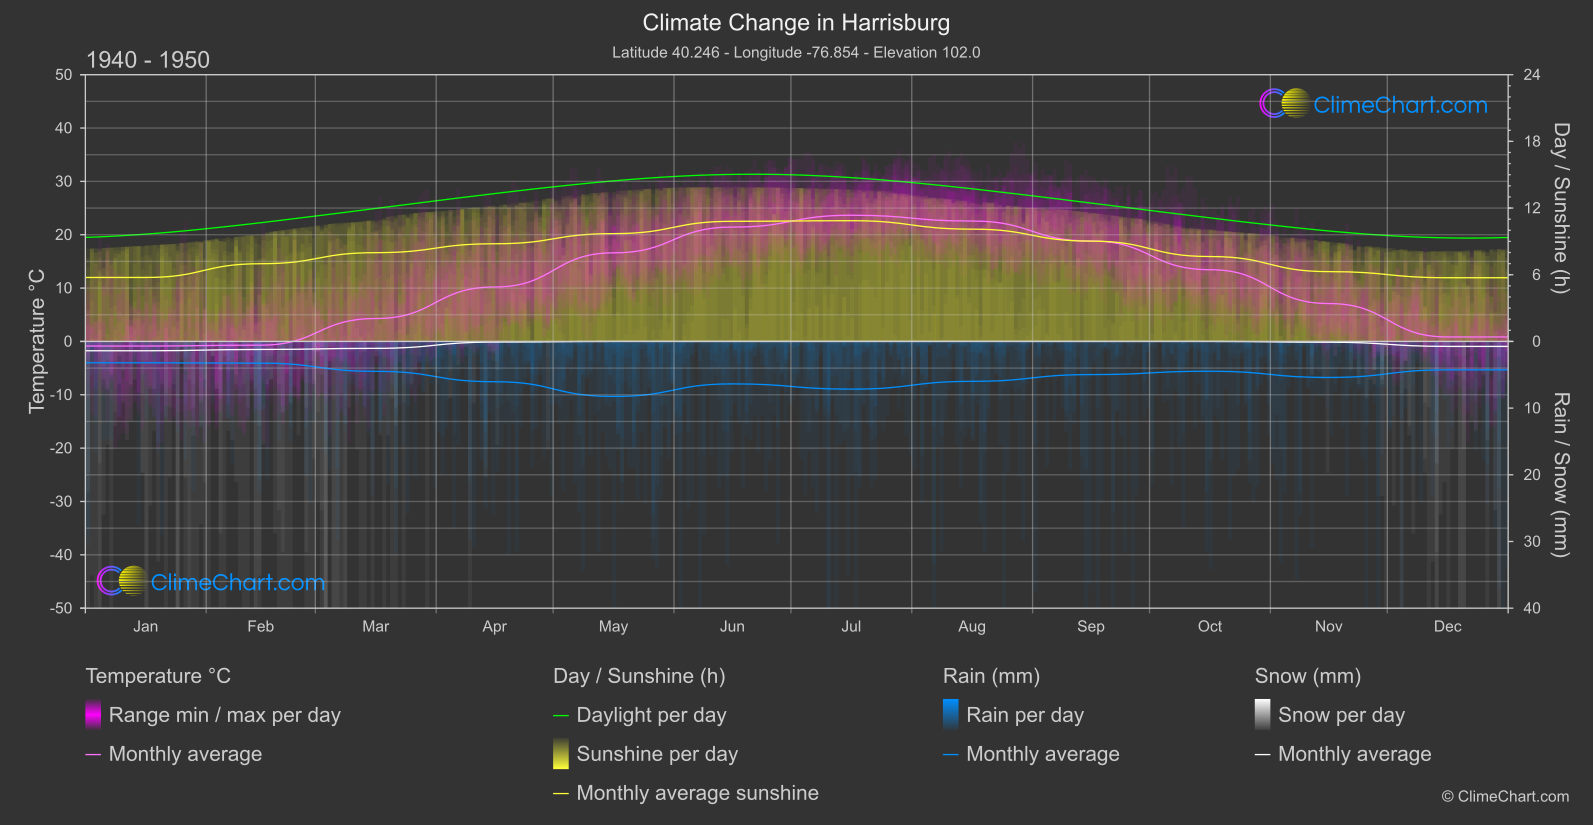
Harrisburg, the capital of Pennsylvania, has experienced noticeable changes in climate parameters. Analysis of the data from 1940-1950 to 2013-2024 shows that July has seen the highest temperature increase of 1.39°C, while September witnessed the largest rise in rainfall at 0.998 mm. Notably, December displayed a significant increase in temperature by 2.13°C and a rise in snowfall by 0.58 mm. The sunshine duration saw fluctuations throughout the year, with July and August showing positive changes in sunshine hours.
Climate Change Data Overview for Harrisburg, USA
Explore the comprehensive climate change data for Harrisburg, USA. This detailed table provides valuable insights into temperature variations, precipitation levels, and seasonal changes influenced by climate change, helping you understand the unique weather patterns of this region.
Temperature °C
| Month | ⌀ 1940 - 1950 | ⌀ 2013 - 2023 | +/- |
|---|---|---|---|
| Jan | -0.86 | -0.18 | 0.69 |
| Feb | -0.70 | 0.69 | 1.38 |
| Mar | 4.30 | 4.64 | 0.35 |
| Apr | 10.20 | 11.05 | 0.85 |
| May | 16.61 | 16.81 | 0.20 |
| Jun | 21.43 | 21.79 | 0.36 |
| Jul | 23.65 | 25.05 | 1.39 |
| Aug | 22.57 | 23.83 | 1.26 |
| Sep | 18.82 | 20.37 | 1.55 |
| Oct | 13.45 | 14.18 | 0.74 |
| Nov | 7.10 | 6.73 | -0.36 |
| Dec | 0.84 | 2.97 | 2.13 |
| ⌀ Month | 11.45 | 12.33 | 0.88 |
Sunshine (h)
| Month | ⌀ 1940 - 1950 | ⌀ 2013 - 2023 | +/- |
|---|---|---|---|
| Jan | 5.75 | 5.56 | -0.19 |
| Feb | 6.99 | 6.21 | -0.78 |
| Mar | 7.99 | 7.51 | -0.47 |
| Apr | 8.79 | 8.54 | -0.25 |
| May | 9.70 | 9.57 | -0.13 |
| Jun | 10.81 | 11.02 | 0.21 |
| Jul | 10.86 | 11.30 | 0.44 |
| Aug | 10.10 | 10.41 | 0.30 |
| Sep | 9.03 | 8.98 | -0.05 |
| Oct | 7.64 | 7.17 | -0.46 |
| Nov | 6.28 | 6.65 | 0.37 |
| Dec | 5.73 | 4.98 | -0.75 |
| ⌀ Month | 8.31 | 8.16 | -0.15 |
Rain (mm)
| Month | ⌀ 1940 - 1950 | ⌀ 2013 - 2023 | +/- |
|---|---|---|---|
| Jan | 1.60 | 1.75 | 0.15 |
| Feb | 1.63 | 2.10 | 0.47 |
| Mar | 2.24 | 2.03 | -0.22 |
| Apr | 3.02 | 3.19 | 0.17 |
| May | 4.12 | 2.96 | -1.16 |
| Jun | 3.18 | 3.41 | 0.22 |
| Jul | 3.58 | 3.39 | -0.19 |
| Aug | 2.99 | 3.06 | 0.07 |
| Sep | 2.49 | 3.48 | 1.00 |
| Oct | 2.23 | 2.73 | 0.49 |
| Nov | 2.70 | 2.11 | -0.59 |
| Dec | 2.13 | 2.71 | 0.58 |
| ⌀ Month | 2.66 | 2.74 | 0.08 |
Snow (mm)
| Month | ⌀ 1940 - 1950 | ⌀ 2013 - 2023 | +/- |
|---|---|---|---|
| Jan | 0.70 | 0.51 | -0.19 |
| Feb | 0.60 | 0.62 | 0.02 |
| Mar | 0.52 | 0.47 | -0.05 |
| Apr | 0.05 | 0.06 | 0.01 |
| May | 0.00 | 0.00 | 0.00 |
| Jun | 0.00 | 0.00 | 0.00 |
| Jul | 0.00 | 0.00 | 0.00 |
| Aug | 0.00 | 0.00 | 0.00 |
| Sep | 0.00 | 0.00 | 0.00 |
| Oct | 0.00 | 0.00 | 0.00 |
| Nov | 0.06 | 0.14 | 0.08 |
| Dec | 0.37 | 0.27 | -0.10 |
| ⌀ Month | 0.19 | 0.17 | -0.02 |