Climate Change Chart of Hargeisa, Somalia
Comprehensive Climate Change Chart of Hargeisa, Somalia: Monthly Averages and Impact Trends
Explore the changing climate in Hargeisa, Somalia with insightful data analysis. Discover how temperature, rainfall, and sunshine duration have evolved from 1940 - 1950 to 2013 - 2024.
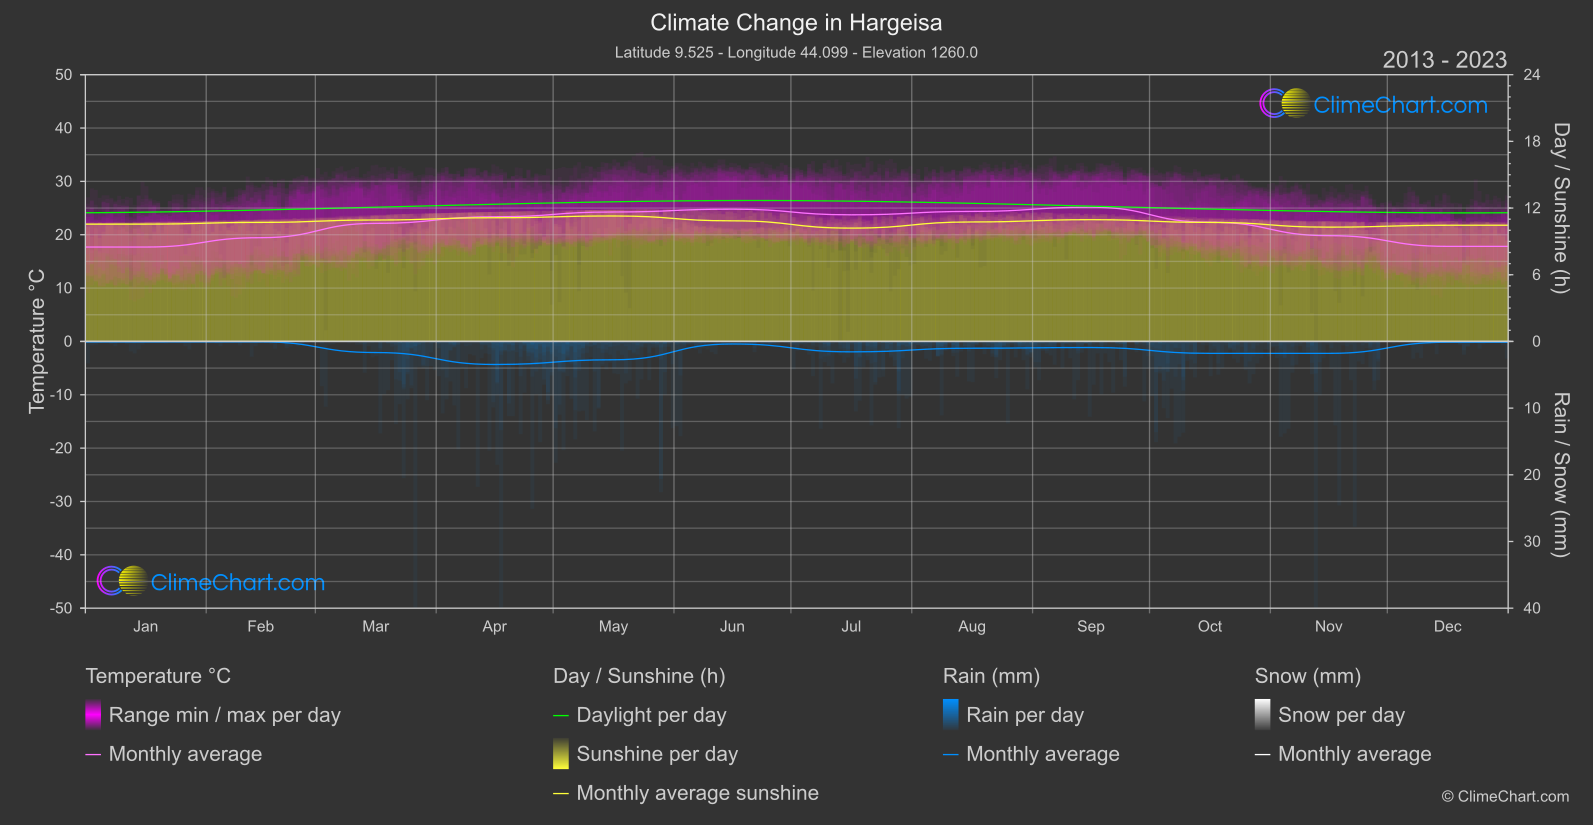
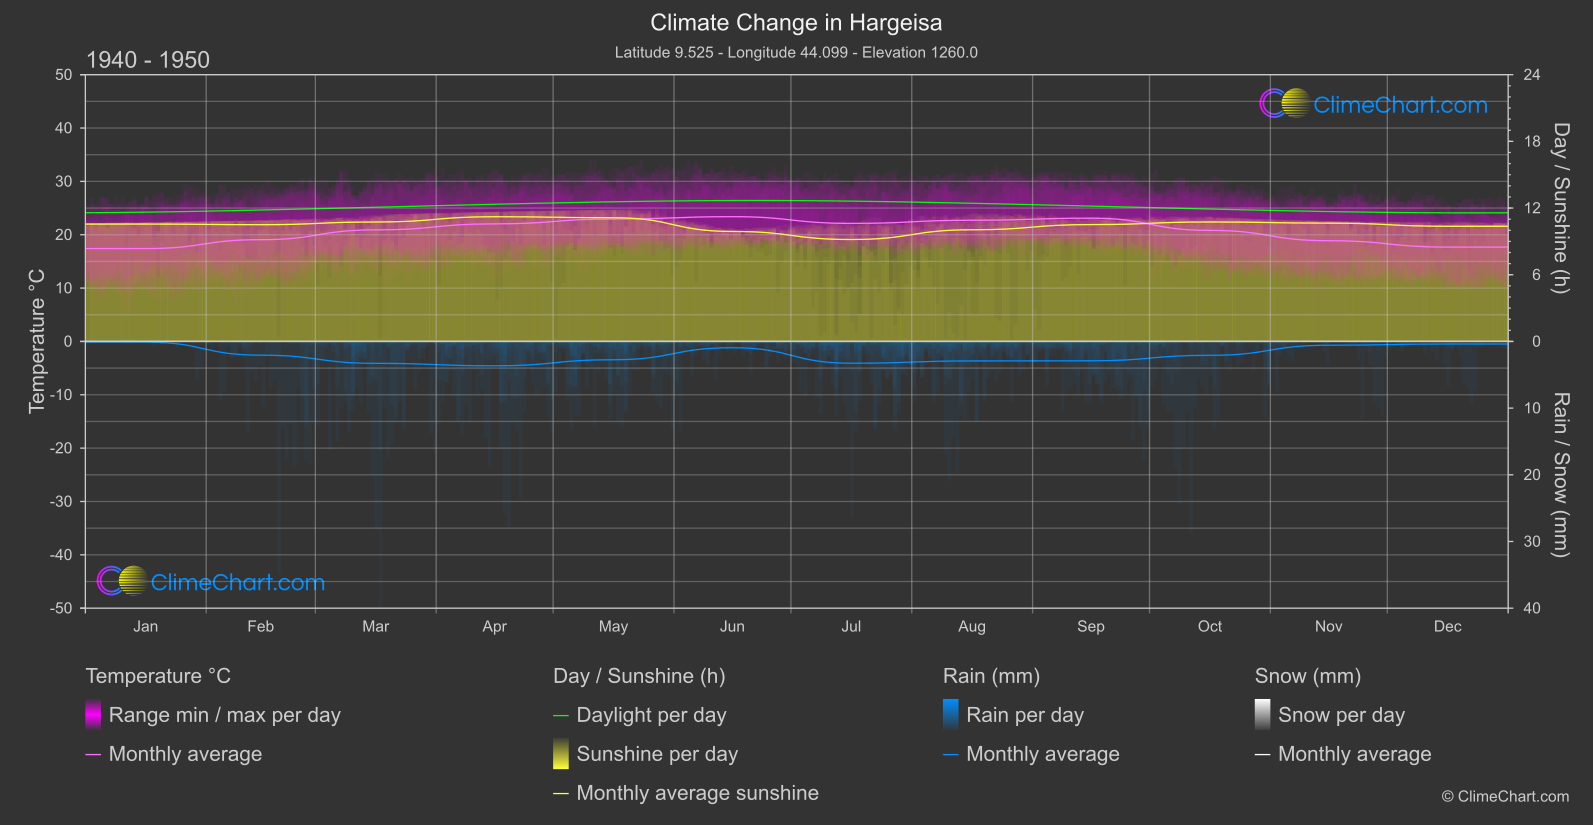
Hargeisa, Somalia has experienced notable changes in its climate over the years. From the data comparison between 1940 - 1950 and 2013 - 2024, it is evident that the month with the highest temperature change is September, with a significant increase of 2.055°C. On the other hand, January saw a decrease in rainfall by 0.0136 mm. Additionally, July had the most significant decline in sunshine duration, dropping by 1.609 hours. These trends indicate a shift towards warmer temperatures and altered precipitation patterns in Hargeisa.
Climate Change Data Overview for Hargeisa, Somalia
Explore the comprehensive climate change data for Hargeisa, Somalia. This detailed table provides valuable insights into temperature variations, precipitation levels, and seasonal changes influenced by climate change, helping you understand the unique weather patterns of this region.
Temperature °C
| Month | ⌀ 1940 - 1950 | ⌀ 2013 - 2023 | +/- |
|---|---|---|---|
| Jan | 17.41 | 17.69 | 0.29 |
| Feb | 19.07 | 19.45 | 0.37 |
| Mar | 20.91 | 22.13 | 1.22 |
| Apr | 22.04 | 23.37 | 1.33 |
| May | 22.94 | 24.26 | 1.33 |
| Jun | 23.38 | 24.79 | 1.41 |
| Jul | 22.12 | 23.73 | 1.61 |
| Aug | 22.71 | 24.37 | 1.66 |
| Sep | 23.10 | 25.16 | 2.06 |
| Oct | 20.81 | 22.34 | 1.53 |
| Nov | 18.88 | 19.83 | 0.95 |
| Dec | 17.68 | 17.82 | 0.14 |
| ⌀ Month | 20.92 | 22.08 | 1.16 |
Sunshine (h)
| Month | ⌀ 1940 - 1950 | ⌀ 2013 - 2023 | +/- |
|---|---|---|---|
| Jan | 10.56 | 10.56 | -0.00 |
| Feb | 10.50 | 10.71 | 0.21 |
| Mar | 10.74 | 10.92 | 0.18 |
| Apr | 11.22 | 11.13 | -0.09 |
| May | 11.13 | 11.29 | 0.16 |
| Jun | 9.89 | 10.85 | 0.96 |
| Jul | 9.17 | 10.20 | 1.02 |
| Aug | 10.04 | 10.75 | 0.70 |
| Sep | 10.51 | 10.95 | 0.44 |
| Oct | 10.75 | 10.71 | -0.04 |
| Nov | 10.64 | 10.28 | -0.36 |
| Dec | 10.36 | 10.45 | 0.09 |
| ⌀ Month | 10.46 | 10.73 | 0.27 |
Rain (mm)
| Month | ⌀ 1940 - 1950 | ⌀ 2013 - 2023 | +/- |
|---|---|---|---|
| Jan | 0.05 | 0.04 | -0.01 |
| Feb | 1.03 | 0.03 | -1.00 |
| Mar | 1.64 | 0.83 | -0.81 |
| Apr | 1.83 | 1.73 | -0.10 |
| May | 1.37 | 1.37 | 0.00 |
| Jun | 0.47 | 0.19 | -0.28 |
| Jul | 1.63 | 0.78 | -0.85 |
| Aug | 1.46 | 0.51 | -0.95 |
| Sep | 1.45 | 0.46 | -1.00 |
| Oct | 1.04 | 0.89 | -0.15 |
| Nov | 0.28 | 0.90 | 0.61 |
| Dec | 0.19 | 0.06 | -0.13 |
| ⌀ Month | 1.04 | 0.65 | -0.39 |
Snow (mm)
| Month | ⌀ 1940 - 1950 | ⌀ 2013 - 2023 | +/- |
|---|---|---|---|
| Jan | 0.00 | 0.00 | 0.00 |
| Feb | 0.00 | 0.00 | 0.00 |
| Mar | 0.00 | 0.00 | 0.00 |
| Apr | 0.00 | 0.00 | 0.00 |
| May | 0.00 | 0.00 | 0.00 |
| Jun | 0.00 | 0.00 | 0.00 |
| Jul | 0.00 | 0.00 | 0.00 |
| Aug | 0.00 | 0.00 | 0.00 |
| Sep | 0.00 | 0.00 | 0.00 |
| Oct | 0.00 | 0.00 | 0.00 |
| Nov | 0.00 | 0.00 | 0.00 |
| Dec | 0.00 | 0.00 | 0.00 |
| ⌀ Month | 0.00 | 0.00 | 0.00 |