Climate Change Chart of Hallstatt, Austria
Comprehensive Climate Change Chart of Hallstatt, Austria: Monthly Averages and Impact Trends
Exploring the climate change data for Hallstatt, Austria reveals significant shifts in temperature, rainfall, snowfall, and sunshine duration over the years. Let's delve into the insights provided by the data.
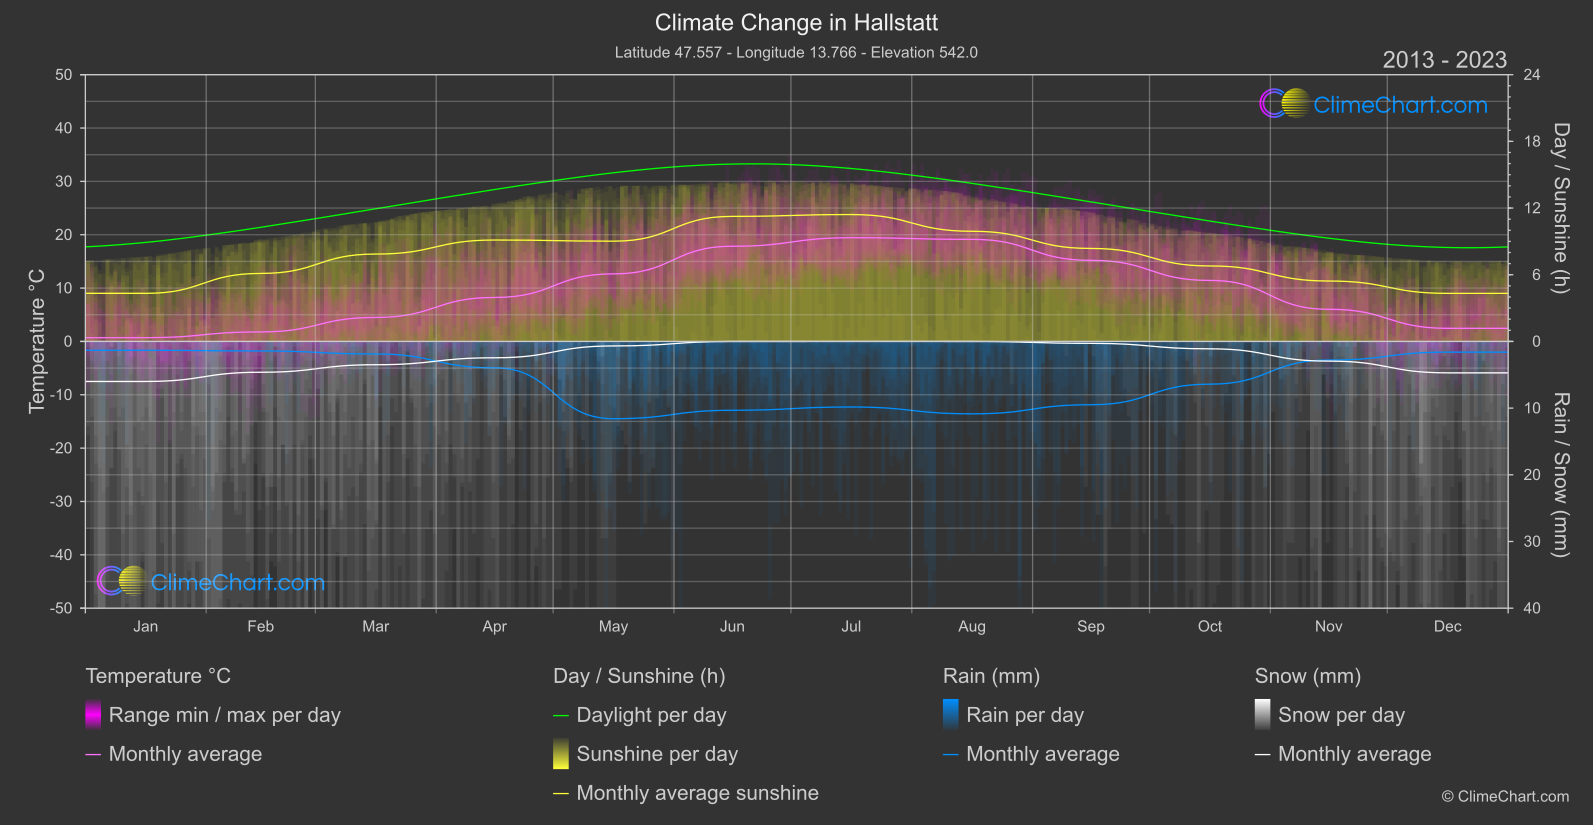
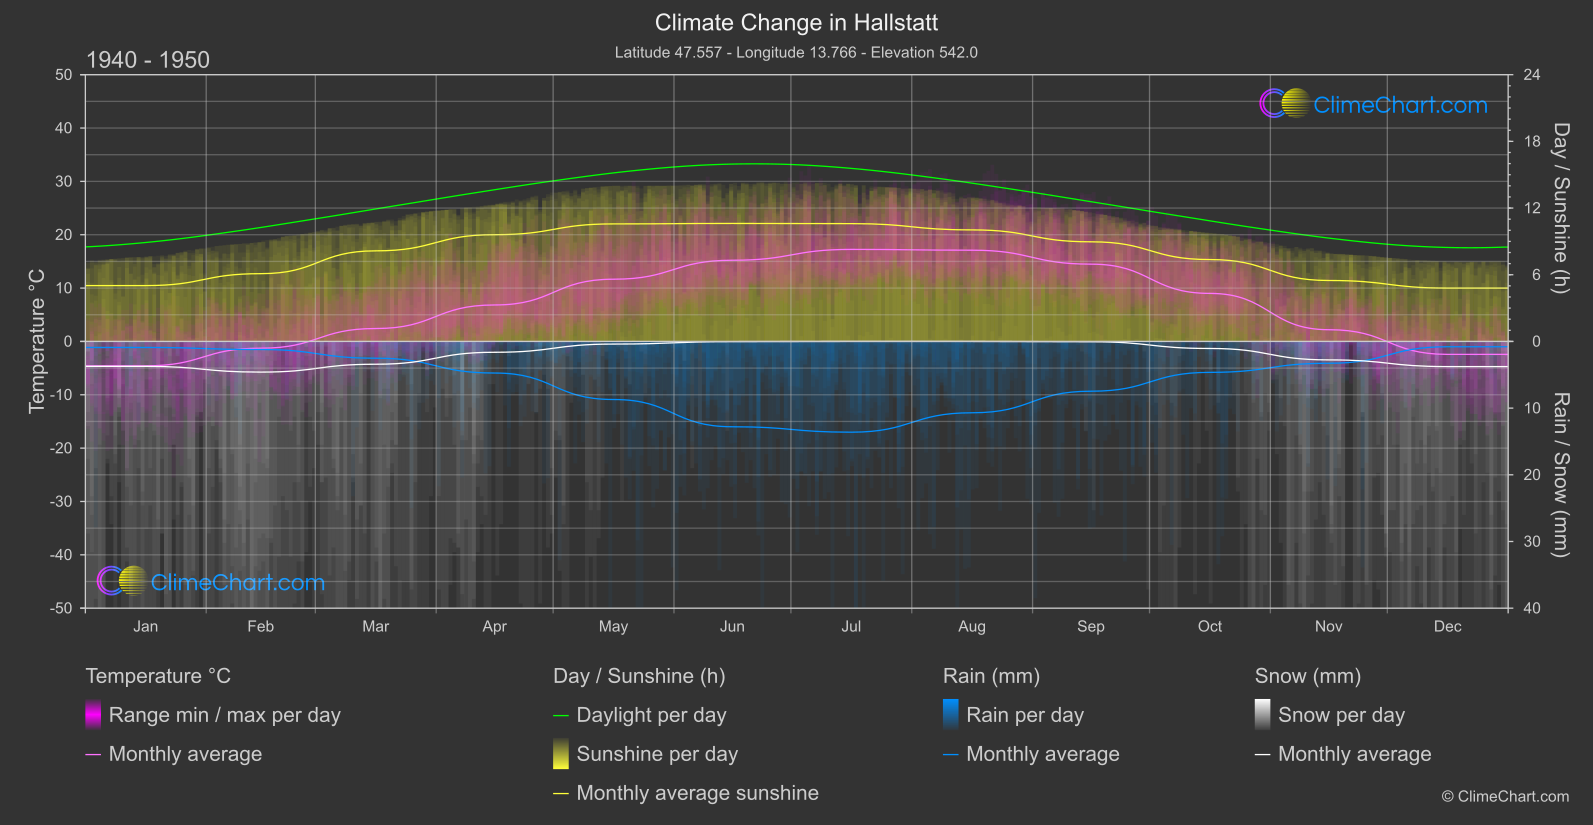
Hallstatt, Austria has experienced notable changes in its climate patterns. The data shows that over the years, there has been a consistent increase in temperatures across most months, with the highest temperature change observed in December. Additionally, rainfall patterns have also shifted, with some months experiencing increased rainfall while others show a decrease. Snowfall has generally decreased, particularly in the summer months. Furthermore, sunshine duration has shown variations, with some months having more sunshine hours compared to the past. These trends highlight the impact of climate change on the weather in Hallstatt.
Climate Change Data Overview for Hallstatt, Austria
Explore the comprehensive climate change data for Hallstatt, Austria. This detailed table provides valuable insights into temperature variations, precipitation levels, and seasonal changes influenced by climate change, helping you understand the unique weather patterns of this region.
Temperature °C
| Month | ⌀ 1940 - 1950 | ⌀ 2013 - 2023 | +/- |
|---|---|---|---|
| Jan | -4.57 | 0.70 | 5.27 |
| Feb | -1.27 | 1.79 | 3.05 |
| Mar | 2.42 | 4.50 | 2.08 |
| Apr | 6.84 | 8.24 | 1.41 |
| May | 11.66 | 12.67 | 1.00 |
| Jun | 15.22 | 17.84 | 2.62 |
| Jul | 17.25 | 19.44 | 2.19 |
| Aug | 17.10 | 19.13 | 2.03 |
| Sep | 14.49 | 15.20 | 0.71 |
| Oct | 9.00 | 11.43 | 2.43 |
| Nov | 2.20 | 6.03 | 3.83 |
| Dec | -2.43 | 2.46 | 4.88 |
| ⌀ Month | 7.33 | 9.95 | 2.63 |
Sunshine (h)
| Month | ⌀ 1940 - 1950 | ⌀ 2013 - 2023 | +/- |
|---|---|---|---|
| Jan | 5.02 | 4.33 | -0.70 |
| Feb | 6.10 | 6.12 | 0.02 |
| Mar | 8.15 | 7.86 | -0.29 |
| Apr | 9.60 | 9.12 | -0.48 |
| May | 10.57 | 9.02 | -1.55 |
| Jun | 10.62 | 11.25 | 0.64 |
| Jul | 10.60 | 11.42 | 0.82 |
| Aug | 10.04 | 9.91 | -0.13 |
| Sep | 8.96 | 8.37 | -0.60 |
| Oct | 7.37 | 6.79 | -0.58 |
| Nov | 5.48 | 5.44 | -0.05 |
| Dec | 4.80 | 4.32 | -0.47 |
| ⌀ Month | 8.11 | 7.83 | -0.28 |
Rain (mm)
| Month | ⌀ 1940 - 1950 | ⌀ 2013 - 2023 | +/- |
|---|---|---|---|
| Jan | 0.45 | 0.66 | 0.21 |
| Feb | 0.61 | 0.71 | 0.11 |
| Mar | 1.26 | 0.94 | -0.32 |
| Apr | 2.37 | 1.98 | -0.39 |
| May | 4.35 | 5.79 | 1.44 |
| Jun | 6.40 | 5.16 | -1.24 |
| Jul | 6.80 | 4.92 | -1.89 |
| Aug | 5.35 | 5.43 | 0.08 |
| Sep | 3.73 | 4.75 | 1.01 |
| Oct | 2.32 | 3.20 | 0.88 |
| Nov | 1.64 | 1.40 | -0.24 |
| Dec | 0.40 | 0.80 | 0.40 |
| ⌀ Month | 2.97 | 2.98 | 0.01 |
Snow (mm)
| Month | ⌀ 1940 - 1950 | ⌀ 2013 - 2023 | +/- |
|---|---|---|---|
| Jan | 1.87 | 3.00 | 1.13 |
| Feb | 2.30 | 2.31 | 0.01 |
| Mar | 1.71 | 1.75 | 0.04 |
| Apr | 0.81 | 1.23 | 0.41 |
| May | 0.20 | 0.34 | 0.14 |
| Jun | 0.01 | 0.00 | -0.01 |
| Jul | 0.00 | 0.00 | 0.00 |
| Aug | 0.00 | 0.00 | 0.00 |
| Sep | 0.02 | 0.14 | 0.12 |
| Oct | 0.53 | 0.55 | 0.03 |
| Nov | 1.38 | 1.48 | 0.09 |
| Dec | 1.89 | 2.36 | 0.47 |
| ⌀ Month | 0.89 | 1.10 | 0.20 |