Climate Change Chart of Ha Long, Viet Nam
Comprehensive Climate Change Chart of Ha Long, Viet Nam: Monthly Averages and Impact Trends
Exploring the changing climate in Ha Long, Viet Nam reveals intriguing insights into temperature, rainfall, and sunshine duration trends over the years.
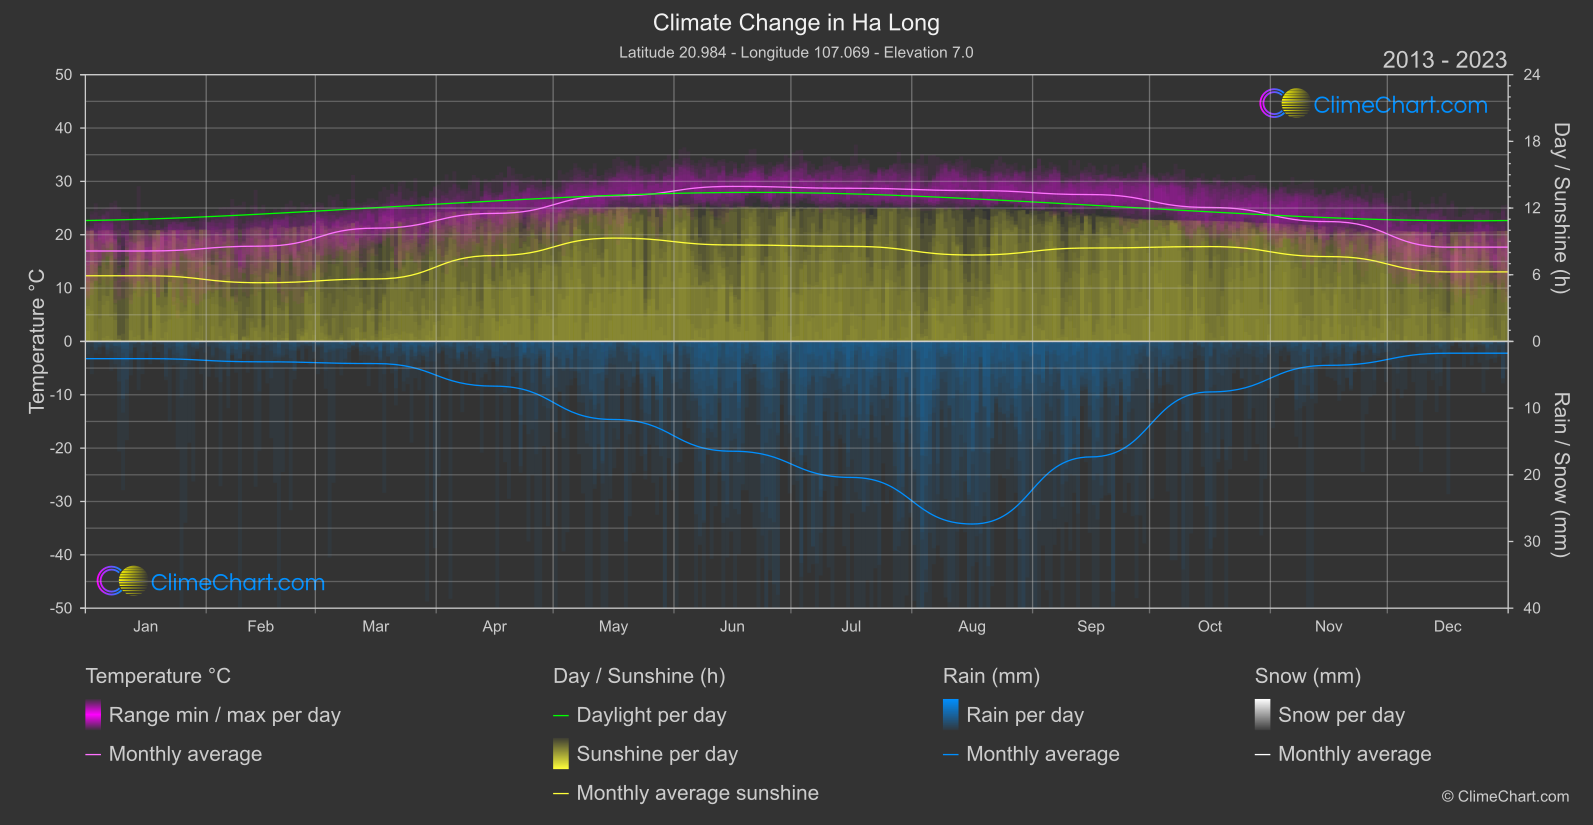
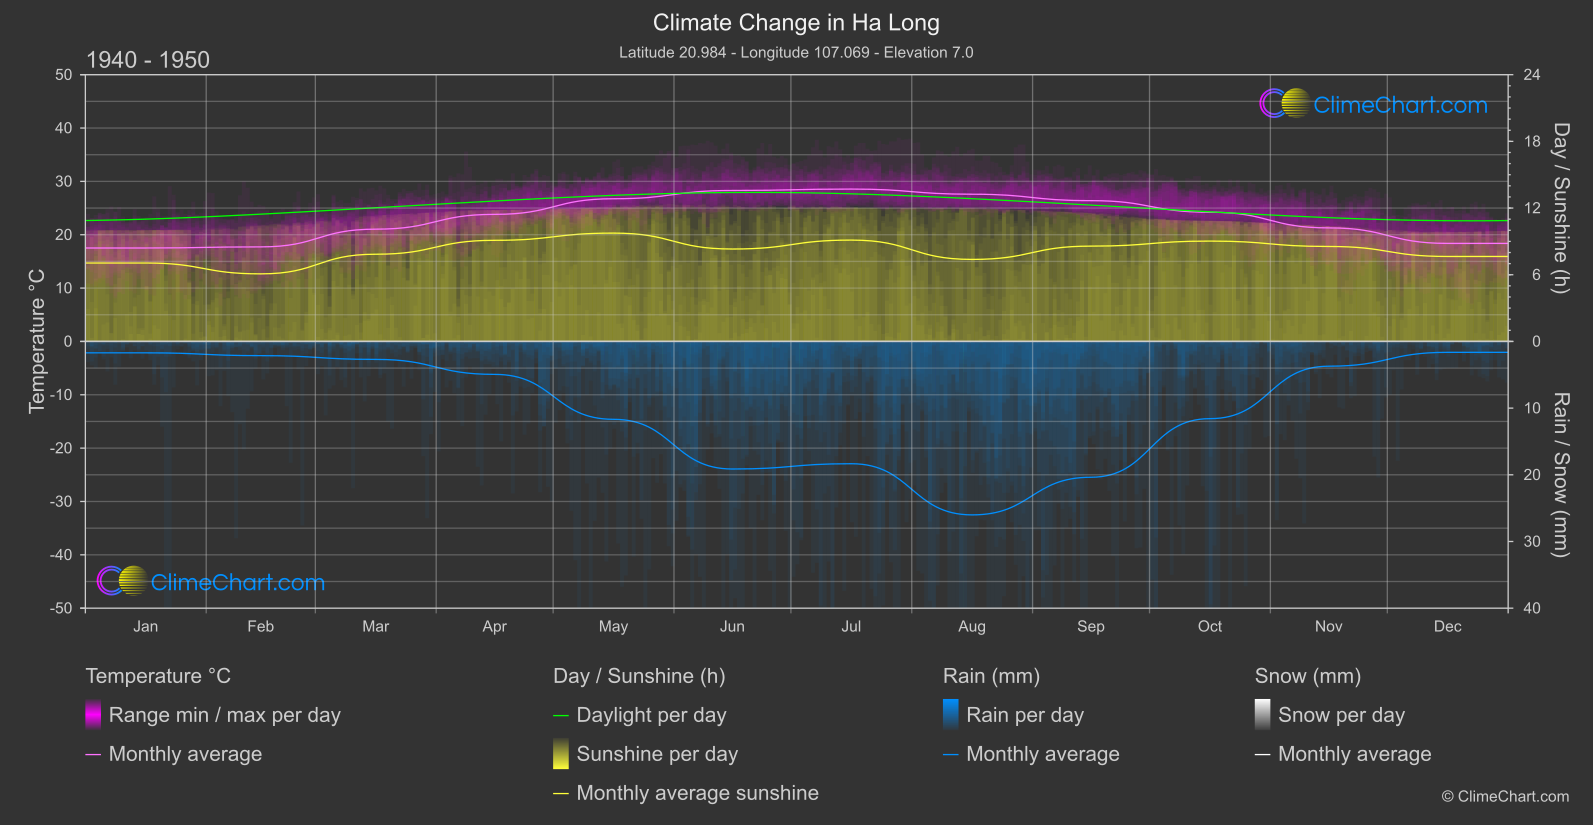
Ha Long, Viet Nam, has experienced changes in temperature, rainfall, and sunshine duration over the years. Analyzing the data, we find that September has shown the highest increase in temperature, while October has experienced the highest decrease in rainfall. The sunshine duration has remained relatively stable throughout the months.
Climate Change Data Overview for Ha Long, Viet Nam
Explore the comprehensive climate change data for Ha Long, Viet Nam. This detailed table provides valuable insights into temperature variations, precipitation levels, and seasonal changes influenced by climate change, helping you understand the unique weather patterns of this region.
Temperature °C
| Month | ⌀ 1940 - 1950 | ⌀ 2013 - 2023 | +/- |
|---|---|---|---|
| Jan | 17.52 | 16.95 | -0.56 |
| Feb | 17.72 | 17.86 | 0.14 |
| Mar | 21.04 | 21.24 | 0.19 |
| Apr | 23.82 | 24.00 | 0.18 |
| May | 26.75 | 27.30 | 0.56 |
| Jun | 28.30 | 29.06 | 0.76 |
| Jul | 28.56 | 28.71 | 0.15 |
| Aug | 27.59 | 28.28 | 0.69 |
| Sep | 26.39 | 27.53 | 1.14 |
| Oct | 24.22 | 25.11 | 0.89 |
| Nov | 21.28 | 22.46 | 1.18 |
| Dec | 18.37 | 17.67 | -0.70 |
| ⌀ Month | 23.46 | 23.85 | 0.38 |
Sunshine (h)
| Month | ⌀ 1940 - 1950 | ⌀ 2013 - 2023 | +/- |
|---|---|---|---|
| Jan | 7.06 | 5.91 | -1.15 |
| Feb | 6.08 | 5.28 | -0.80 |
| Mar | 7.85 | 5.62 | -2.23 |
| Apr | 9.10 | 7.73 | -1.37 |
| May | 9.75 | 9.30 | -0.45 |
| Jun | 8.31 | 8.68 | 0.37 |
| Jul | 9.12 | 8.55 | -0.57 |
| Aug | 7.38 | 7.78 | 0.40 |
| Sep | 8.58 | 8.41 | -0.17 |
| Oct | 9.03 | 8.53 | -0.50 |
| Nov | 8.54 | 7.63 | -0.91 |
| Dec | 7.64 | 6.26 | -1.39 |
| ⌀ Month | 8.20 | 7.47 | -0.73 |
Rain (mm)
| Month | ⌀ 1940 - 1950 | ⌀ 2013 - 2023 | +/- |
|---|---|---|---|
| Jan | 0.86 | 1.29 | 0.44 |
| Feb | 1.07 | 1.53 | 0.46 |
| Mar | 1.35 | 1.66 | 0.31 |
| Apr | 2.47 | 3.35 | 0.88 |
| May | 5.84 | 5.85 | 0.01 |
| Jun | 9.57 | 8.23 | -1.33 |
| Jul | 9.17 | 10.20 | 1.03 |
| Aug | 13.01 | 13.69 | 0.68 |
| Sep | 10.18 | 8.66 | -1.52 |
| Oct | 5.79 | 3.79 | -2.00 |
| Nov | 1.86 | 1.79 | -0.06 |
| Dec | 0.82 | 0.88 | 0.07 |
| ⌀ Month | 5.16 | 5.08 | -0.09 |
Snow (mm)
| Month | ⌀ 1940 - 1950 | ⌀ 2013 - 2023 | +/- |
|---|---|---|---|
| Jan | 0.00 | 0.00 | 0.00 |
| Feb | 0.00 | 0.00 | 0.00 |
| Mar | 0.00 | 0.00 | 0.00 |
| Apr | 0.00 | 0.00 | 0.00 |
| May | 0.00 | 0.00 | 0.00 |
| Jun | 0.00 | 0.00 | 0.00 |
| Jul | 0.00 | 0.00 | 0.00 |
| Aug | 0.00 | 0.00 | 0.00 |
| Sep | 0.00 | 0.00 | 0.00 |
| Oct | 0.00 | 0.00 | 0.00 |
| Nov | 0.00 | 0.00 | 0.00 |
| Dec | 0.00 | 0.00 | 0.00 |
| ⌀ Month | 0.00 | 0.00 | 0.00 |