Climate Change Chart of Grytviken, South Georgia and the South Sandwich Islands
Comprehensive Climate Change Chart of Grytviken, South Georgia and the South Sandwich Islands: Monthly Averages and Impact Trends
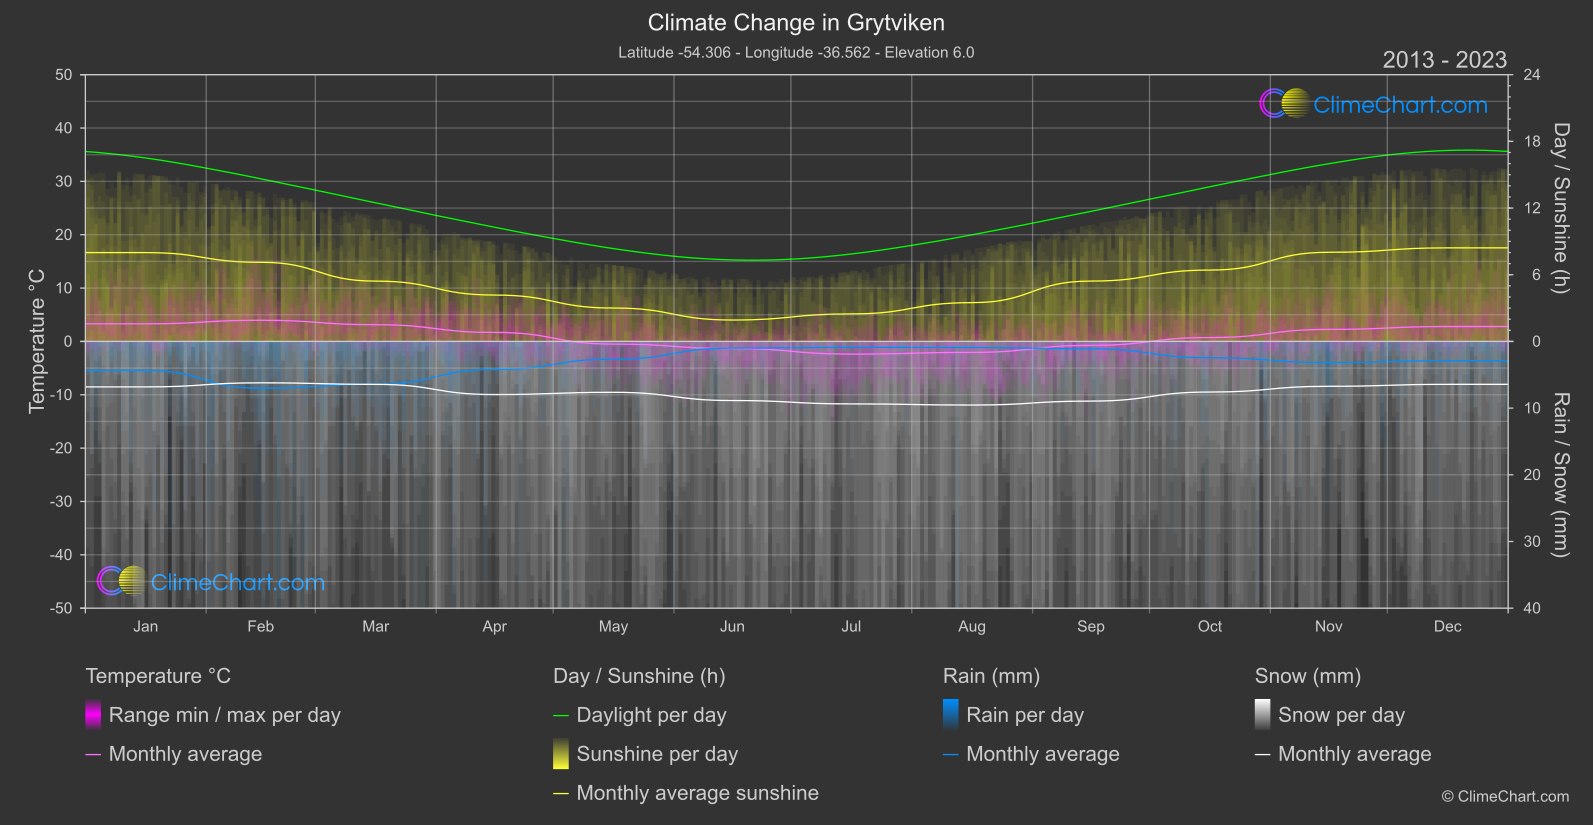
Exploring the changing climate in Grytviken, South Georgia and the South Sandwich Islands reveals intriguing insights into temperature, rainfall, snowfall, and sunshine duration trends over the years.
- Explore the climate in Grytviken
- Explore the climate in South Georgia and the South Sandwich Islands
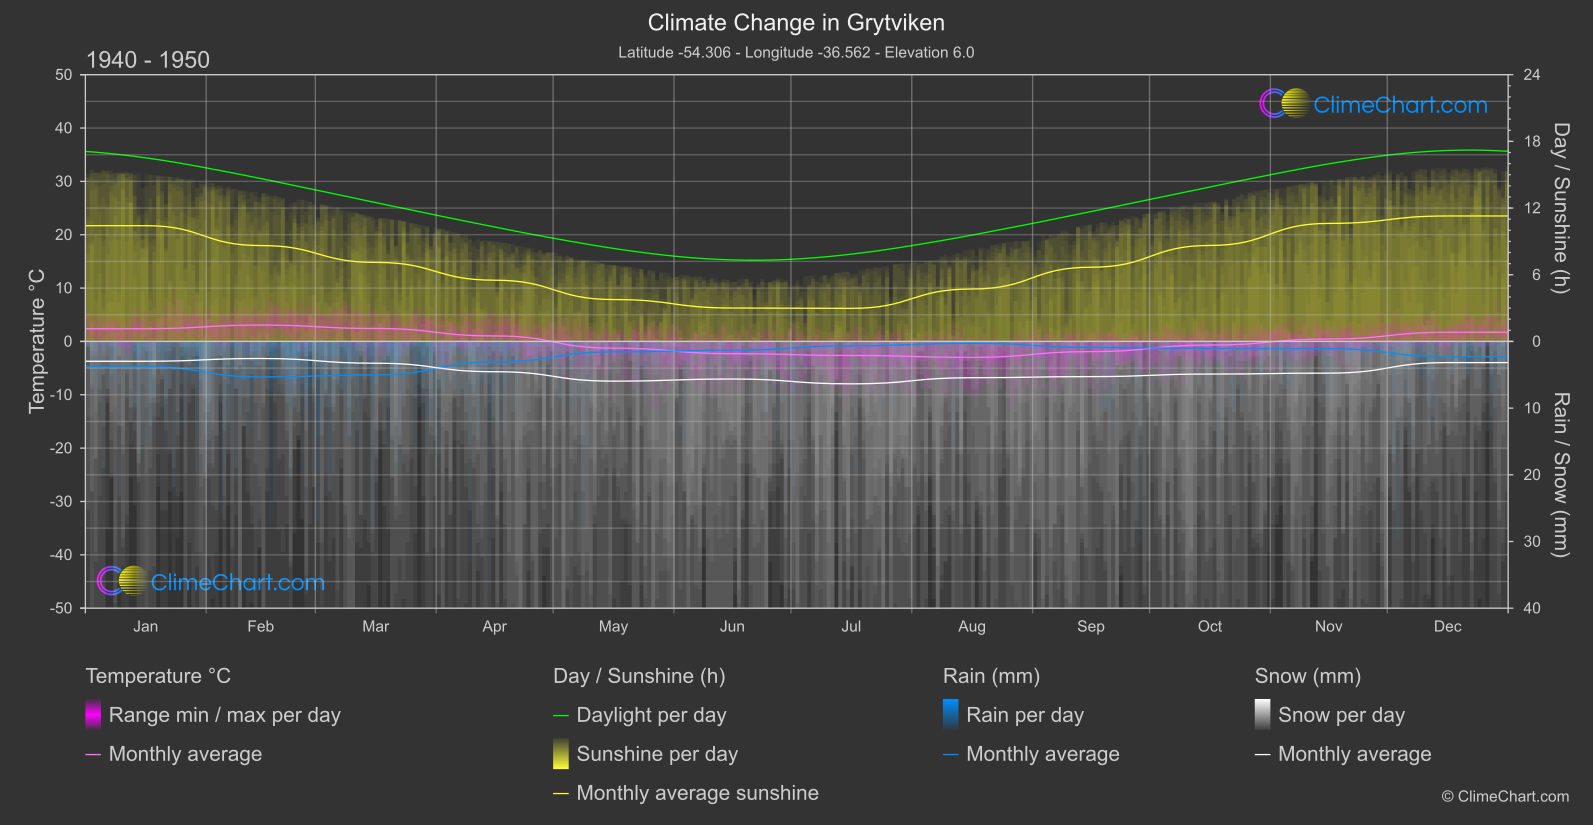
Grytviken, located in South Georgia and the South Sandwich Islands, has experienced notable changes in climate parameters from 1940-1950 to 2013-2024. The data showcases a significant increase in temperatures across most months, with the highest temperature change occurring in November. Rainfall has also shown an upward trend, particularly in the months of October and November. Snowfall has substantially increased in January and March, while sunshine duration has notably decreased in most months.
Climate Change Data Overview for Grytviken, South Georgia and the South Sandwich Islands
Explore the comprehensive climate change data for Grytviken, South Georgia and the South Sandwich Islands. This detailed table provides valuable insights into temperature variations, precipitation levels, and seasonal changes influenced by climate change, helping you understand the unique weather patterns of this region.
Temperature °C
| Month | ⌀ 1940 - 1950 | ⌀ 2013 - 2023 | +/- |
|---|---|---|---|
| Jan | 2.38 | 3.30 | 0.92 |
| Feb | 3.06 | 3.97 | 0.90 |
| Mar | 2.43 | 3.14 | 0.71 |
| Apr | 1.03 | 1.69 | 0.65 |
| May | -1.26 | -0.50 | 0.77 |
| Jun | -2.30 | -1.33 | 0.98 |
| Jul | -2.63 | -2.38 | 0.26 |
| Aug | -2.99 | -2.06 | 0.94 |
| Sep | -1.91 | -0.73 | 1.17 |
| Oct | -0.68 | 0.73 | 1.41 |
| Nov | 0.45 | 2.25 | 1.80 |
| Dec | 1.72 | 2.79 | 1.08 |
| ⌀ Month | -0.06 | 0.91 | 0.97 |
Sunshine (h)
| Month | ⌀ 1940 - 1950 | ⌀ 2013 - 2023 | +/- |
|---|---|---|---|
| Jan | 10.41 | 7.99 | -2.42 |
| Feb | 8.63 | 7.12 | -1.51 |
| Mar | 7.11 | 5.43 | -1.69 |
| Apr | 5.51 | 4.17 | -1.34 |
| May | 3.77 | 3.00 | -0.76 |
| Jun | 3.01 | 1.93 | -1.08 |
| Jul | 2.98 | 2.48 | -0.50 |
| Aug | 4.72 | 3.49 | -1.23 |
| Sep | 6.68 | 5.43 | -1.25 |
| Oct | 8.64 | 6.42 | -2.22 |
| Nov | 10.62 | 8.02 | -2.60 |
| Dec | 11.29 | 8.42 | -2.87 |
| ⌀ Month | 6.95 | 5.32 | -1.62 |
Rain (mm)
| Month | ⌀ 1940 - 1950 | ⌀ 2013 - 2023 | +/- |
|---|---|---|---|
| Jan | 1.90 | 2.17 | 0.27 |
| Feb | 2.66 | 3.51 | 0.85 |
| Mar | 2.51 | 3.21 | 0.70 |
| Apr | 1.54 | 2.10 | 0.56 |
| May | 0.78 | 1.33 | 0.55 |
| Jun | 0.66 | 0.50 | -0.16 |
| Jul | 0.33 | 0.44 | 0.11 |
| Aug | 0.14 | 0.45 | 0.31 |
| Sep | 0.45 | 0.56 | 0.11 |
| Oct | 0.53 | 1.22 | 0.69 |
| Nov | 0.54 | 1.59 | 1.05 |
| Dec | 1.15 | 1.45 | 0.29 |
| ⌀ Month | 1.10 | 1.54 | 0.44 |
Snow (mm)
| Month | ⌀ 1940 - 1950 | ⌀ 2013 - 2023 | +/- |
|---|---|---|---|
| Jan | 1.49 | 3.41 | 1.92 |
| Feb | 1.28 | 3.10 | 1.82 |
| Mar | 1.63 | 3.22 | 1.59 |
| Apr | 2.27 | 3.98 | 1.71 |
| May | 2.98 | 3.81 | 0.84 |
| Jun | 2.82 | 4.43 | 1.61 |
| Jul | 3.18 | 4.68 | 1.50 |
| Aug | 2.72 | 4.77 | 2.05 |
| Sep | 2.64 | 4.47 | 1.84 |
| Oct | 2.45 | 3.79 | 1.35 |
| Nov | 2.38 | 3.36 | 0.99 |
| Dec | 1.59 | 3.22 | 1.63 |
| ⌀ Month | 2.28 | 3.86 | 1.57 |