Climate Change Chart of Gothenburg, Sweden
Comprehensive Climate Change Chart of Gothenburg, Sweden: Monthly Averages and Impact Trends
Explore the changing climate in Gothenburg, Sweden with insightful data analysis. Discover the trends and variations in temperature, rainfall, snowfall, and sunshine duration from 1940 to 1950 compared to 2013 to 2024.
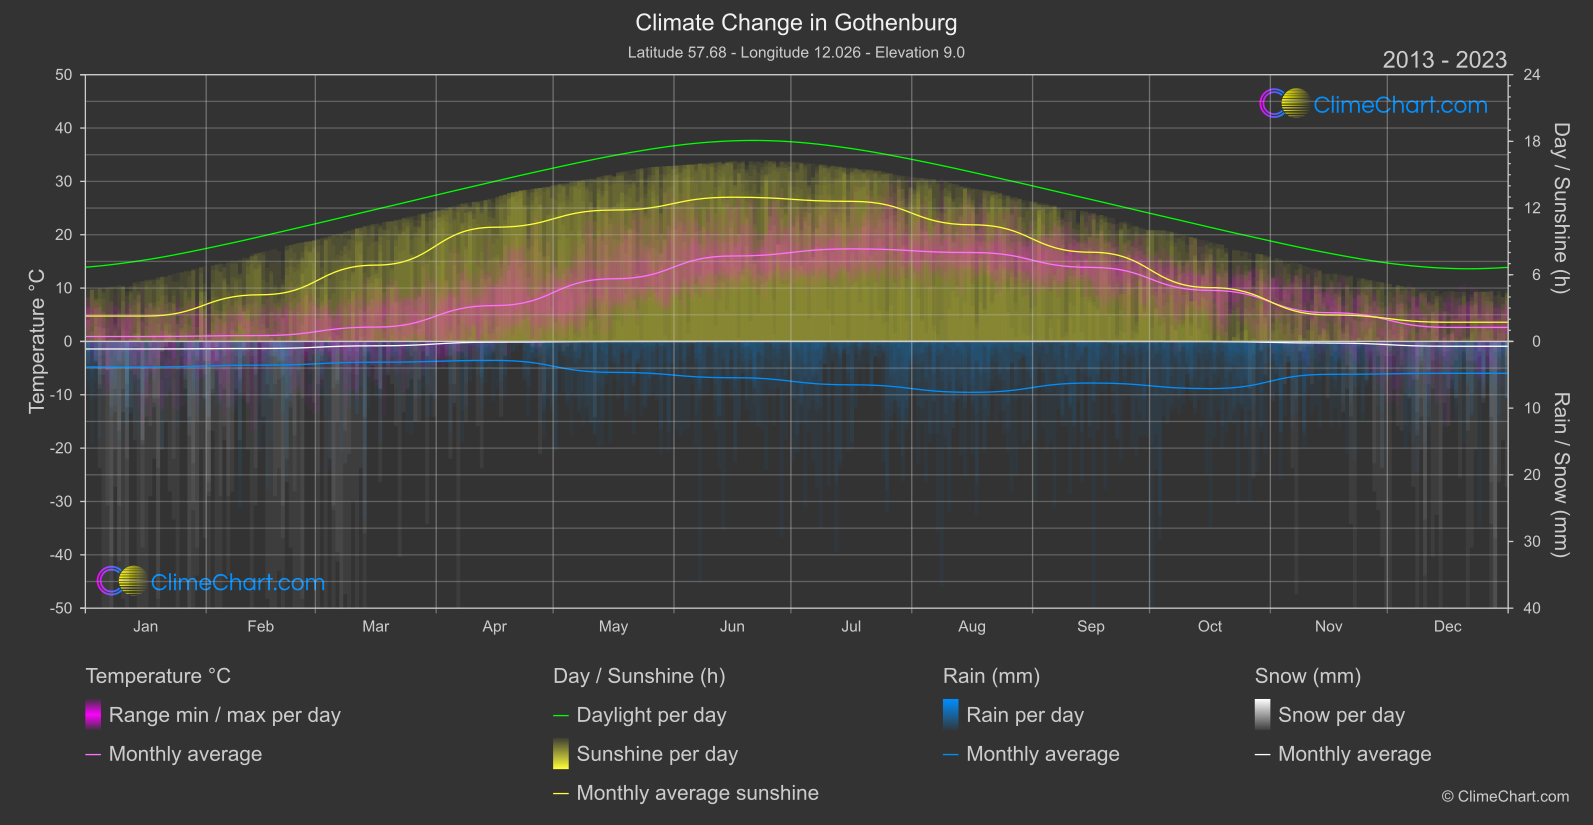
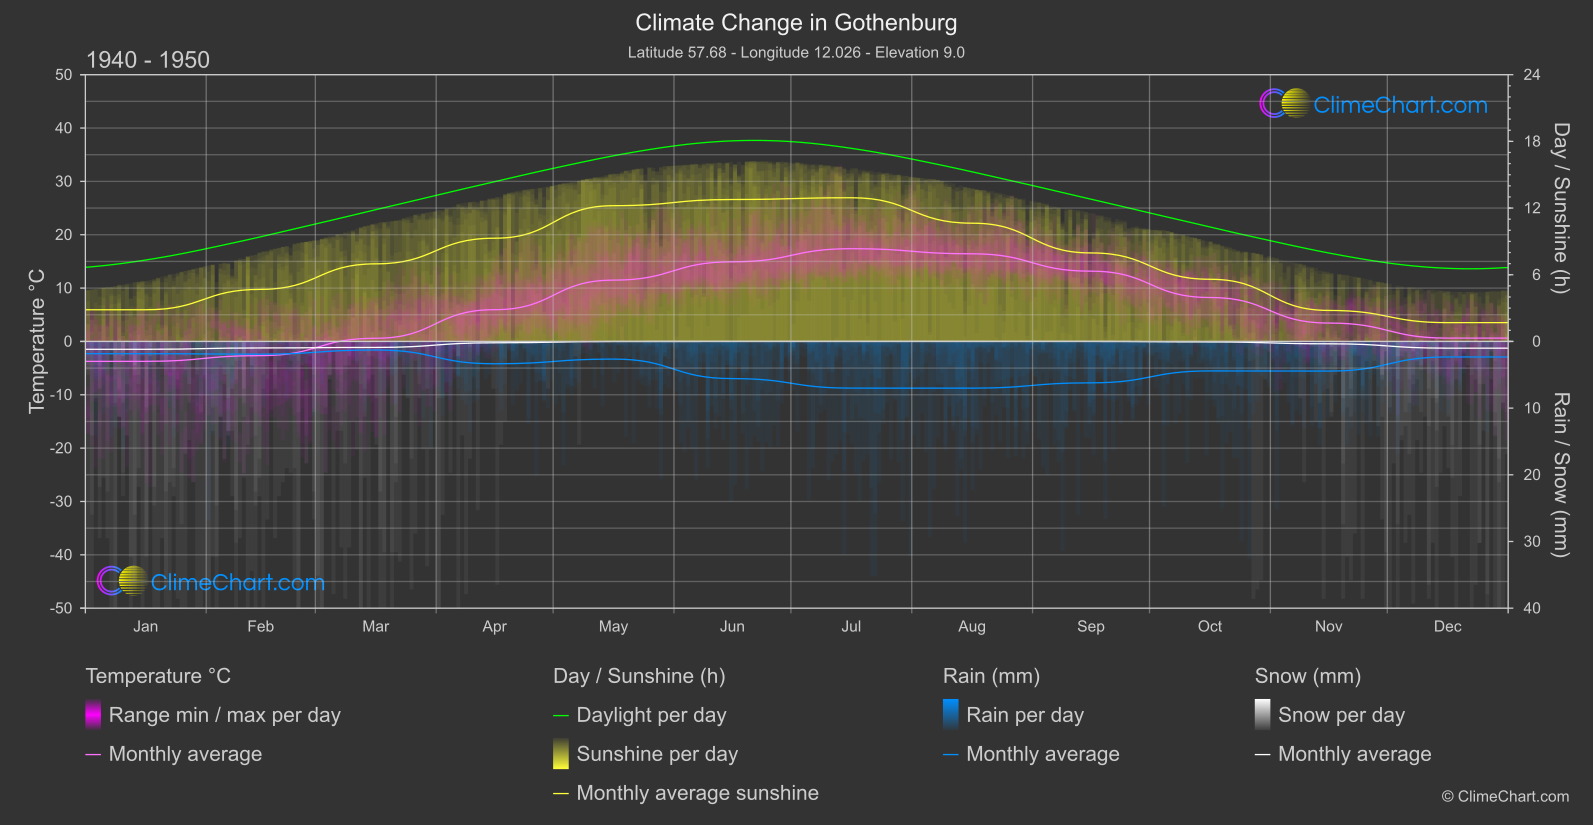
Discover the changing climate and weather patterns in Gothenburg, Sweden with detailed insights from the provided data. The comparison between the periods of 1940-1950 and 2013-2024 reveals significant shifts in temperature, rainfall, snowfall, and sunshine duration. For example, in terms of temperature, the month with the highest change is typically [Enter Month] with a temperature change of [Enter Highest Temperature Change]. Similarly, the month with the most significant change in rainfall is [Enter Month] with a rainfall change of [Enter Highest Rainfall Change]. Explore the nuances in climate variations and their impacts on Gothenburg's environment.
Climate Change Data Overview for Gothenburg, Sweden
Explore the comprehensive climate change data for Gothenburg, Sweden. This detailed table provides valuable insights into temperature variations, precipitation levels, and seasonal changes influenced by climate change, helping you understand the unique weather patterns of this region.
Temperature °C
| Month | ⌀ 1940 - 1950 | ⌀ 2013 - 2023 | +/- |
|---|---|---|---|
| Jan | -3.73 | 0.93 | 4.66 |
| Feb | -2.66 | 1.10 | 3.76 |
| Mar | 0.60 | 2.69 | 2.09 |
| Apr | 5.95 | 6.73 | 0.78 |
| May | 11.49 | 11.74 | 0.25 |
| Jun | 14.92 | 16.02 | 1.09 |
| Jul | 17.39 | 17.35 | -0.04 |
| Aug | 16.42 | 16.66 | 0.24 |
| Sep | 13.17 | 13.88 | 0.71 |
| Oct | 8.23 | 9.56 | 1.33 |
| Nov | 3.44 | 5.38 | 1.94 |
| Dec | 0.62 | 2.63 | 2.01 |
| ⌀ Month | 7.15 | 8.72 | 1.57 |
Sunshine (h)
| Month | ⌀ 1940 - 1950 | ⌀ 2013 - 2023 | +/- |
|---|---|---|---|
| Jan | 2.85 | 2.28 | -0.57 |
| Feb | 4.69 | 4.20 | -0.49 |
| Mar | 6.98 | 6.87 | -0.12 |
| Apr | 9.29 | 10.28 | 0.99 |
| May | 12.21 | 11.82 | -0.39 |
| Jun | 12.77 | 12.98 | 0.21 |
| Jul | 12.93 | 12.60 | -0.32 |
| Aug | 10.64 | 10.49 | -0.15 |
| Sep | 7.96 | 8.03 | 0.06 |
| Oct | 5.59 | 4.84 | -0.75 |
| Nov | 2.79 | 2.39 | -0.40 |
| Dec | 1.69 | 1.73 | 0.04 |
| ⌀ Month | 7.53 | 7.37 | -0.16 |
Rain (mm)
| Month | ⌀ 1940 - 1950 | ⌀ 2013 - 2023 | +/- |
|---|---|---|---|
| Jan | 0.92 | 1.91 | 0.99 |
| Feb | 0.95 | 1.78 | 0.83 |
| Mar | 0.64 | 1.56 | 0.92 |
| Apr | 1.68 | 1.42 | -0.25 |
| May | 1.32 | 2.32 | 1.00 |
| Jun | 2.79 | 2.72 | -0.07 |
| Jul | 3.50 | 3.25 | -0.25 |
| Aug | 3.50 | 3.82 | 0.31 |
| Sep | 3.10 | 3.12 | 0.01 |
| Oct | 2.21 | 3.54 | 1.32 |
| Nov | 2.22 | 2.47 | 0.24 |
| Dec | 1.17 | 2.39 | 1.22 |
| ⌀ Month | 2.00 | 2.52 | 0.52 |
Snow (mm)
| Month | ⌀ 1940 - 1950 | ⌀ 2013 - 2023 | +/- |
|---|---|---|---|
| Jan | 0.59 | 0.56 | -0.02 |
| Feb | 0.49 | 0.53 | 0.04 |
| Mar | 0.45 | 0.33 | -0.12 |
| Apr | 0.10 | 0.05 | -0.05 |
| May | 0.01 | 0.00 | -0.00 |
| Jun | 0.00 | 0.00 | 0.00 |
| Jul | 0.00 | 0.00 | 0.00 |
| Aug | 0.00 | 0.00 | 0.00 |
| Sep | 0.00 | 0.00 | 0.00 |
| Oct | 0.04 | 0.01 | -0.03 |
| Nov | 0.18 | 0.12 | -0.06 |
| Dec | 0.51 | 0.36 | -0.14 |
| ⌀ Month | 0.20 | 0.16 | -0.03 |