Climate Change Chart of George Town, Cayman Islands
Comprehensive Climate Change Chart of George Town, Cayman Islands: Monthly Averages and Impact Trends
Discover the changing climate trends in George Town, Cayman Islands, with insights on temperature, rainfall, and sunshine duration.
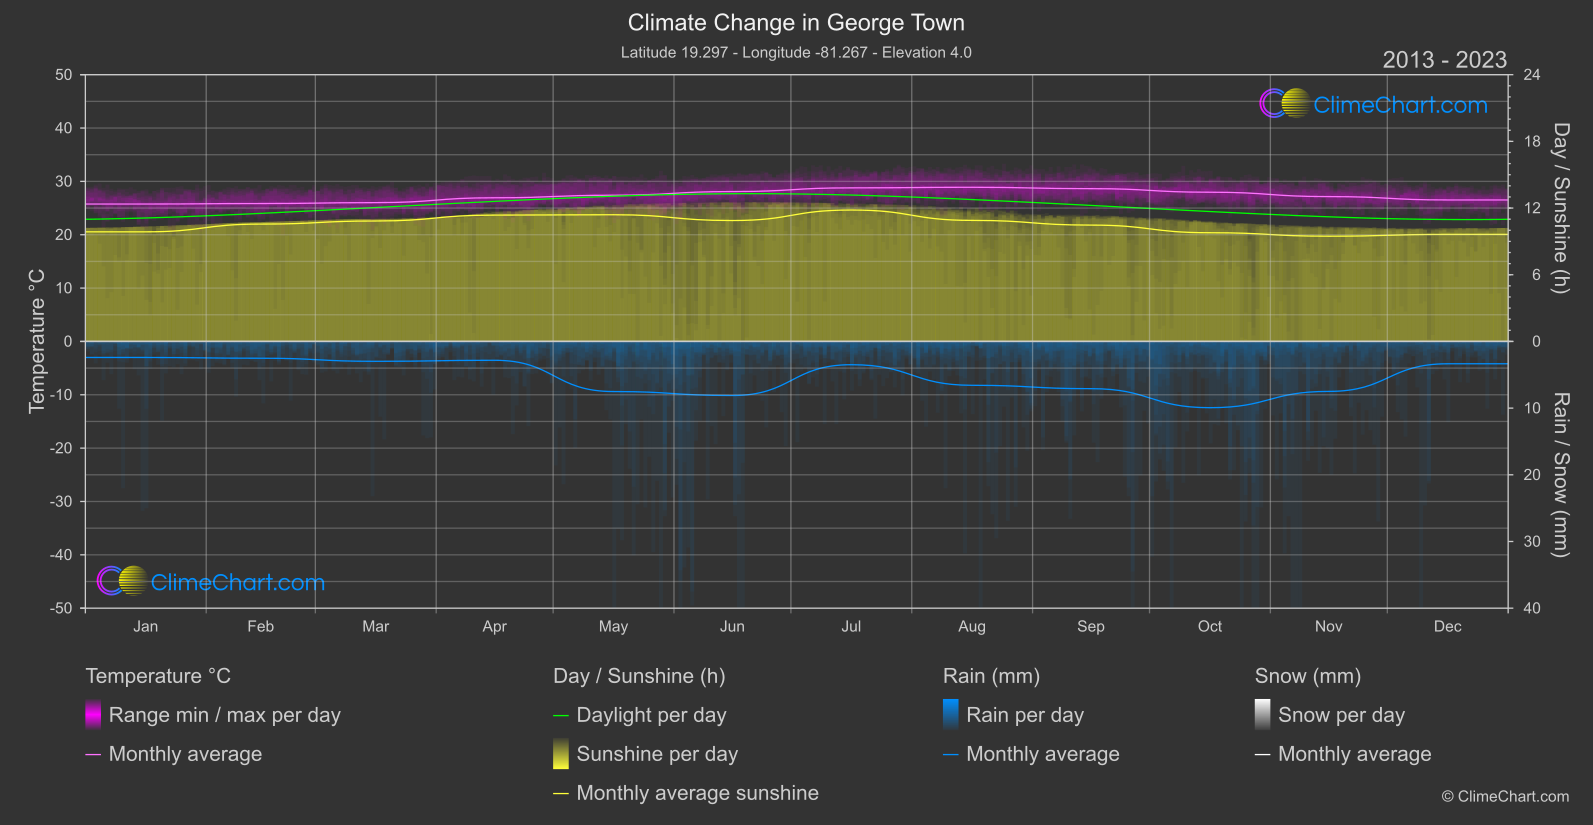
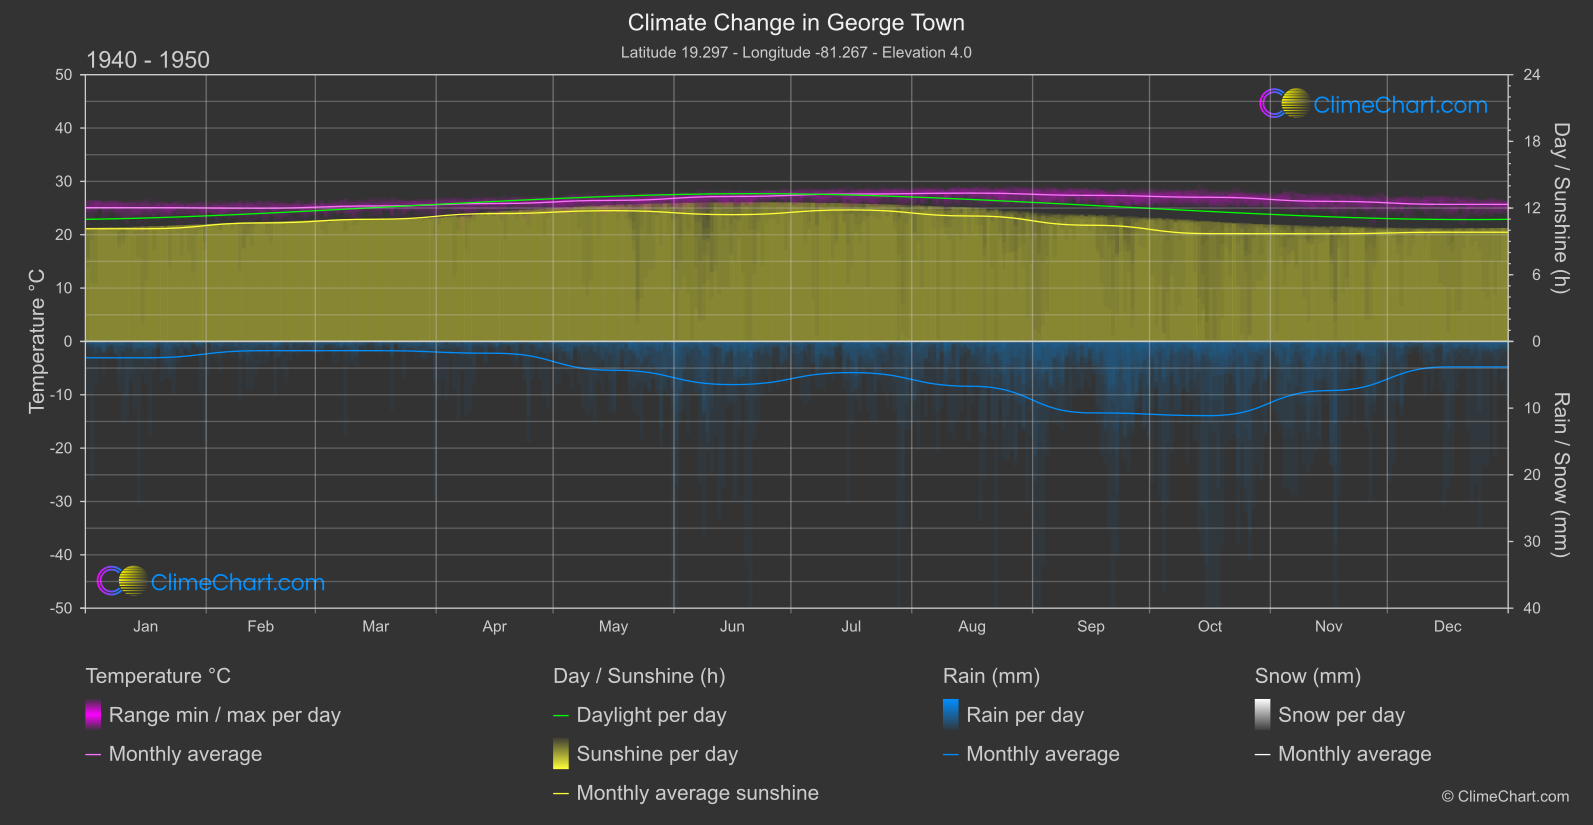
George Town, Cayman Islands experiences a notable increase in temperature over the years, with the month of September showing the highest change. In terms of rainfall, May exhibits a significant rise in precipitation levels compared to the 1940s. The sunshine duration in George Town has slightly decreased, particularly in June and August.
Climate Change Data Overview for George Town, Cayman Islands
Explore the comprehensive climate change data for George Town, Cayman Islands. This detailed table provides valuable insights into temperature variations, precipitation levels, and seasonal changes influenced by climate change, helping you understand the unique weather patterns of this region.
Temperature °C
| Month | ⌀ 1940 - 1950 | ⌀ 2013 - 2023 | +/- |
|---|---|---|---|
| Jan | 25.08 | 25.75 | 0.68 |
| Feb | 24.97 | 25.85 | 0.87 |
| Mar | 25.39 | 26.02 | 0.63 |
| Apr | 25.85 | 26.93 | 1.08 |
| May | 26.44 | 27.40 | 0.96 |
| Jun | 27.17 | 28.09 | 0.92 |
| Jul | 27.62 | 28.79 | 1.17 |
| Aug | 27.80 | 28.89 | 1.10 |
| Sep | 27.38 | 28.64 | 1.25 |
| Oct | 27.02 | 27.97 | 0.95 |
| Nov | 26.25 | 27.15 | 0.90 |
| Dec | 25.69 | 26.52 | 0.83 |
| ⌀ Month | 26.39 | 27.33 | 0.94 |
Sunshine (h)
| Month | ⌀ 1940 - 1950 | ⌀ 2013 - 2023 | +/- |
|---|---|---|---|
| Jan | 10.14 | 9.86 | -0.28 |
| Feb | 10.66 | 10.56 | -0.11 |
| Mar | 11.00 | 10.84 | -0.16 |
| Apr | 11.50 | 11.37 | -0.14 |
| May | 11.76 | 11.40 | -0.36 |
| Jun | 11.41 | 10.88 | -0.53 |
| Jul | 11.83 | 11.82 | -0.01 |
| Aug | 11.28 | 10.89 | -0.39 |
| Sep | 10.45 | 10.47 | 0.01 |
| Oct | 9.70 | 9.78 | 0.08 |
| Nov | 9.69 | 9.47 | -0.22 |
| Dec | 9.83 | 9.63 | -0.19 |
| ⌀ Month | 10.77 | 10.58 | -0.19 |
Rain (mm)
| Month | ⌀ 1940 - 1950 | ⌀ 2013 - 2023 | +/- |
|---|---|---|---|
| Jan | 1.23 | 1.20 | -0.02 |
| Feb | 0.70 | 1.26 | 0.56 |
| Mar | 0.69 | 1.49 | 0.80 |
| Apr | 0.89 | 1.41 | 0.53 |
| May | 2.16 | 3.76 | 1.60 |
| Jun | 3.24 | 4.05 | 0.82 |
| Jul | 2.34 | 1.75 | -0.59 |
| Aug | 3.37 | 3.29 | -0.08 |
| Sep | 5.36 | 3.54 | -1.82 |
| Oct | 5.56 | 4.97 | -0.60 |
| Nov | 3.69 | 3.75 | 0.06 |
| Dec | 1.91 | 1.68 | -0.23 |
| ⌀ Month | 2.59 | 2.68 | 0.09 |
Snow (mm)
| Month | ⌀ 1940 - 1950 | ⌀ 2013 - 2023 | +/- |
|---|---|---|---|
| Jan | 0.00 | 0.00 | 0.00 |
| Feb | 0.00 | 0.00 | 0.00 |
| Mar | 0.00 | 0.00 | 0.00 |
| Apr | 0.00 | 0.00 | 0.00 |
| May | 0.00 | 0.00 | 0.00 |
| Jun | 0.00 | 0.00 | 0.00 |
| Jul | 0.00 | 0.00 | 0.00 |
| Aug | 0.00 | 0.00 | 0.00 |
| Sep | 0.00 | 0.00 | 0.00 |
| Oct | 0.00 | 0.00 | 0.00 |
| Nov | 0.00 | 0.00 | 0.00 |
| Dec | 0.00 | 0.00 | 0.00 |
| ⌀ Month | 0.00 | 0.00 | 0.00 |