Climate Change Chart of Frigg Fjord, Greenland
Comprehensive Climate Change Chart of Frigg Fjord, Greenland: Monthly Averages and Impact Trends
Explore the changing climate in Frigg Fjord, Greenland through insightful data analysis. Discover how temperature, rainfall, snowfall, and sunshine duration have evolved from 1940-1950 to 2013-2024.
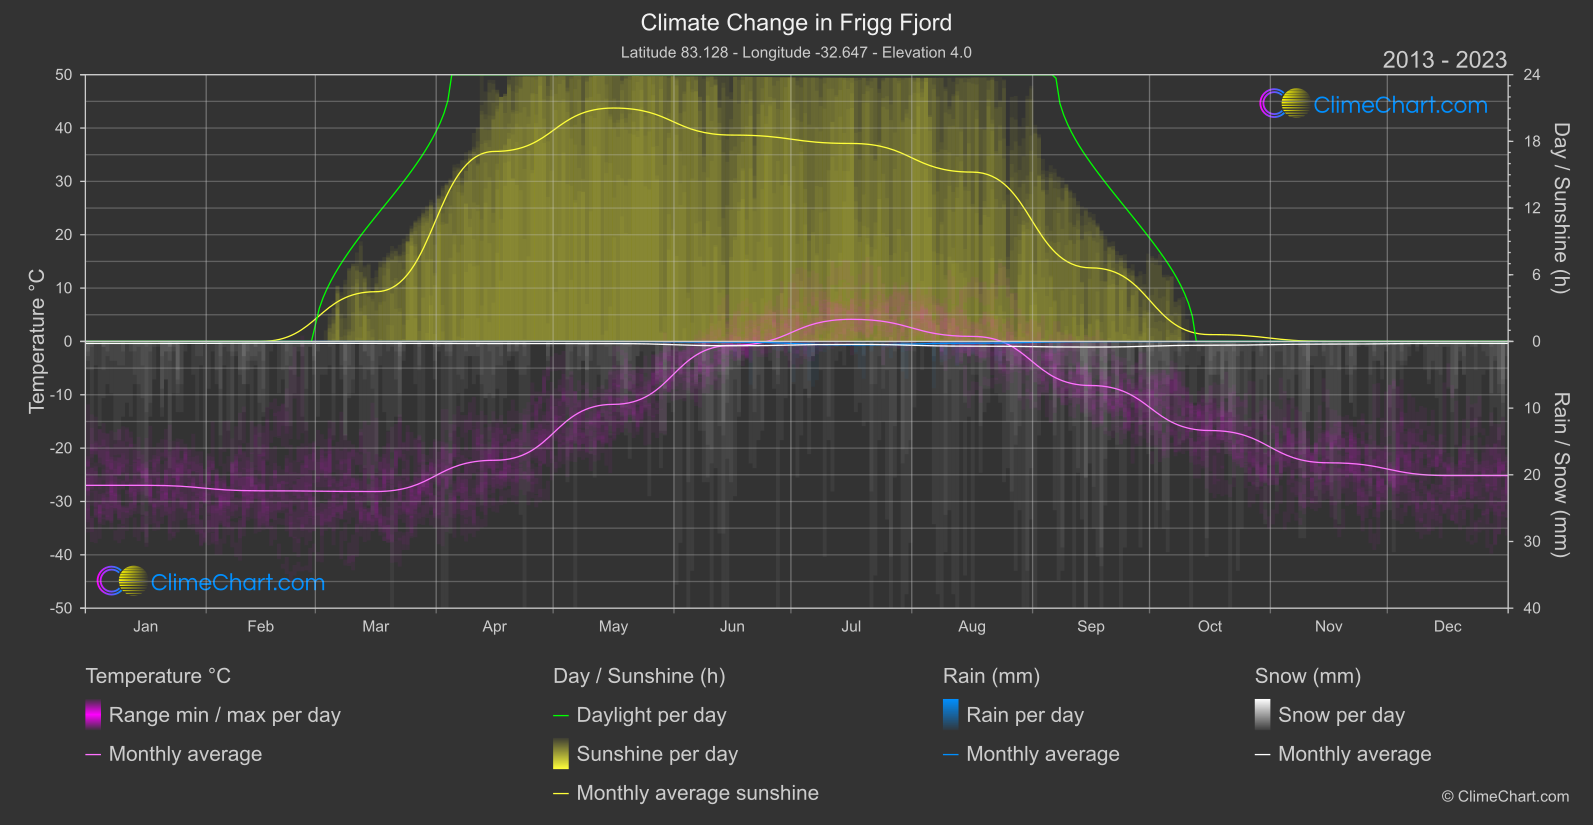
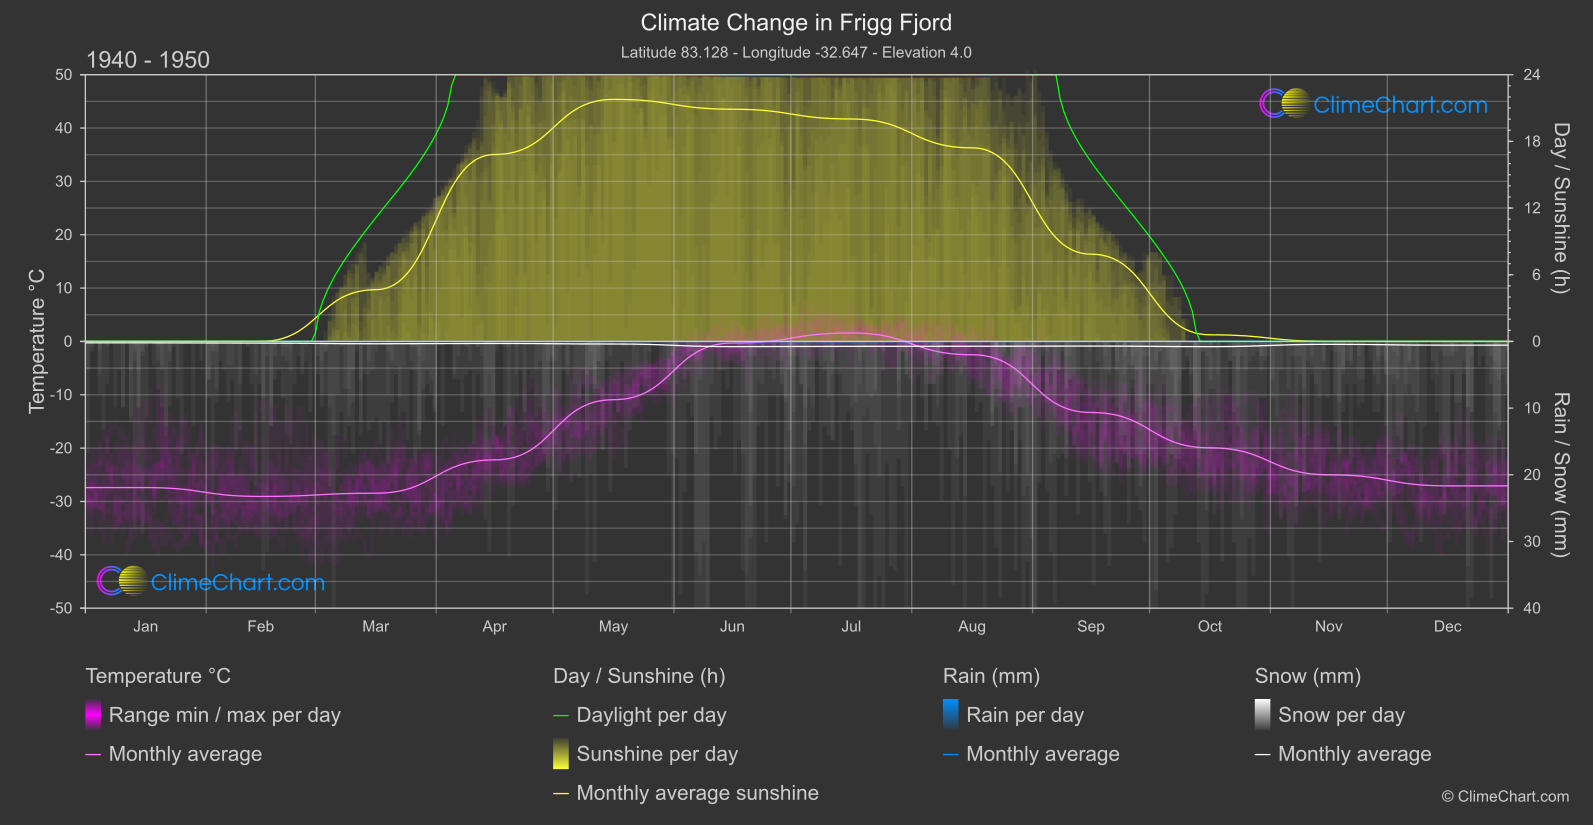
Frigg Fjord in Greenland has experienced significant changes in climate over the years. The data shows interesting patterns such as a notable increase in temperature during July and August, indicating warmer summer months. Additionally, the analysis reveals a substantial rise in rainfall from June to July, suggesting a shift towards wetter conditions during these months. Snowfall has decreased in several months, particularly in June and July, reflecting changing precipitation trends. Furthermore, sunshine duration has shown fluctuations, with varying levels of sunlight exposure observed across different months. These insights provide valuable information on the evolving climate dynamics in Frigg Fjord, Greenland.
Climate Change Data Overview for Frigg Fjord, Greenland
Explore the comprehensive climate change data for Frigg Fjord, Greenland. This detailed table provides valuable insights into temperature variations, precipitation levels, and seasonal changes influenced by climate change, helping you understand the unique weather patterns of this region.
Temperature °C
| Month | ⌀ 1940 - 1950 | ⌀ 2013 - 2023 | +/- |
|---|---|---|---|
| Jan | -27.40 | -26.97 | 0.42 |
| Feb | -29.06 | -28.00 | 1.06 |
| Mar | -28.45 | -28.13 | 0.32 |
| Apr | -22.20 | -22.28 | -0.07 |
| May | -10.92 | -11.79 | -0.87 |
| Jun | -0.30 | -0.72 | -0.42 |
| Jul | 1.59 | 4.14 | 2.56 |
| Aug | -2.50 | 0.94 | 3.44 |
| Sep | -13.32 | -8.27 | 5.05 |
| Oct | -19.95 | -16.70 | 3.25 |
| Nov | -25.00 | -22.75 | 2.24 |
| Dec | -27.08 | -25.14 | 1.93 |
| ⌀ Month | -17.05 | -15.47 | 1.58 |
Sunshine (h)
| Month | ⌀ 1940 - 1950 | ⌀ 2013 - 2023 | +/- |
|---|---|---|---|
| Jan | 0.00 | 0.00 | 0.00 |
| Feb | 0.00 | 0.00 | 0.00 |
| Mar | 4.66 | 4.48 | -0.18 |
| Apr | 16.82 | 17.10 | 0.28 |
| May | 21.78 | 21.00 | -0.78 |
| Jun | 20.89 | 18.57 | -2.33 |
| Jul | 20.01 | 17.81 | -2.20 |
| Aug | 17.42 | 15.24 | -2.18 |
| Sep | 7.85 | 6.62 | -1.23 |
| Oct | 0.60 | 0.61 | 0.02 |
| Nov | 0.00 | 0.00 | 0.00 |
| Dec | 0.00 | 0.00 | 0.00 |
| ⌀ Month | 9.17 | 8.45 | -0.72 |
Rain (mm)
| Month | ⌀ 1940 - 1950 | ⌀ 2013 - 2023 | +/- |
|---|---|---|---|
| Jan | 0.00 | 0.00 | 0.00 |
| Feb | 0.00 | 0.00 | 0.00 |
| Mar | 0.00 | 0.00 | 0.00 |
| Apr | 0.00 | 0.00 | 0.00 |
| May | 0.00 | 0.00 | -0.00 |
| Jun | 0.01 | 0.05 | 0.04 |
| Jul | 0.02 | 0.26 | 0.24 |
| Aug | 0.01 | 0.13 | 0.12 |
| Sep | 0.00 | 0.01 | 0.01 |
| Oct | 0.00 | 0.00 | 0.00 |
| Nov | 0.00 | 0.00 | 0.00 |
| Dec | 0.00 | 0.00 | 0.00 |
| ⌀ Month | 0.00 | 0.04 | 0.04 |
Snow (mm)
| Month | ⌀ 1940 - 1950 | ⌀ 2013 - 2023 | +/- |
|---|---|---|---|
| Jan | 0.11 | 0.15 | 0.04 |
| Feb | 0.13 | 0.14 | 0.01 |
| Mar | 0.17 | 0.15 | -0.03 |
| Apr | 0.15 | 0.16 | 0.01 |
| May | 0.19 | 0.16 | -0.03 |
| Jun | 0.39 | 0.32 | -0.07 |
| Jul | 0.37 | 0.22 | -0.15 |
| Aug | 0.36 | 0.35 | -0.01 |
| Sep | 0.35 | 0.42 | 0.07 |
| Oct | 0.39 | 0.28 | -0.10 |
| Nov | 0.22 | 0.20 | -0.02 |
| Dec | 0.28 | 0.15 | -0.13 |
| ⌀ Month | 0.26 | 0.23 | -0.03 |