Climate Change Chart of Frankfurt, Germany
Comprehensive Climate Change Chart of Frankfurt, Germany: Monthly Averages and Impact Trends
Exploring the climate changes in Frankfurt, Germany reveals intriguing insights into the shifting weather patterns. Discover how the temperature, rainfall, snowfall, and sunshine duration have evolved over the years.
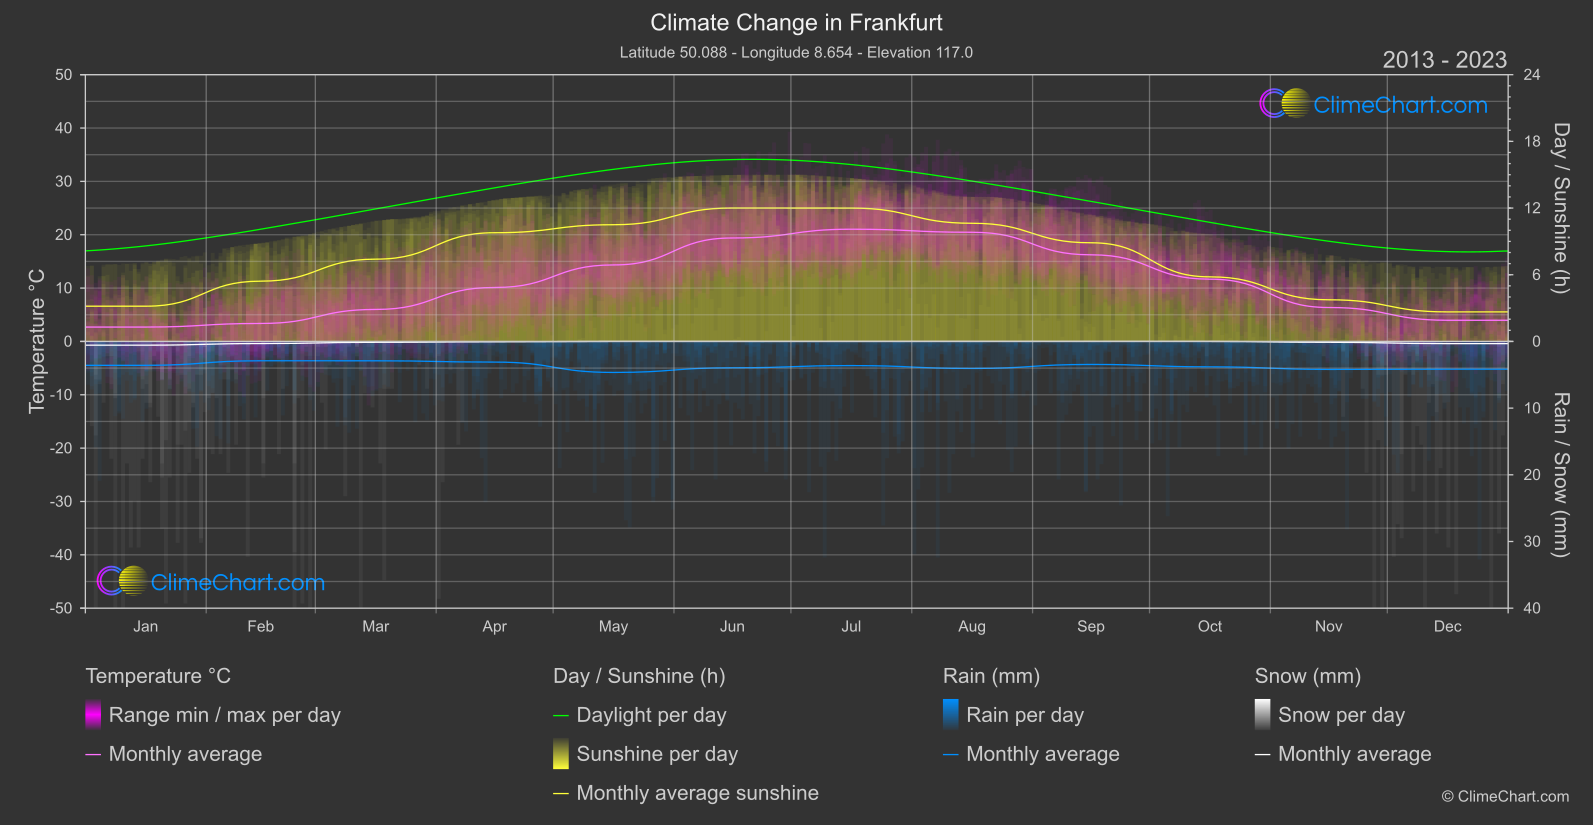
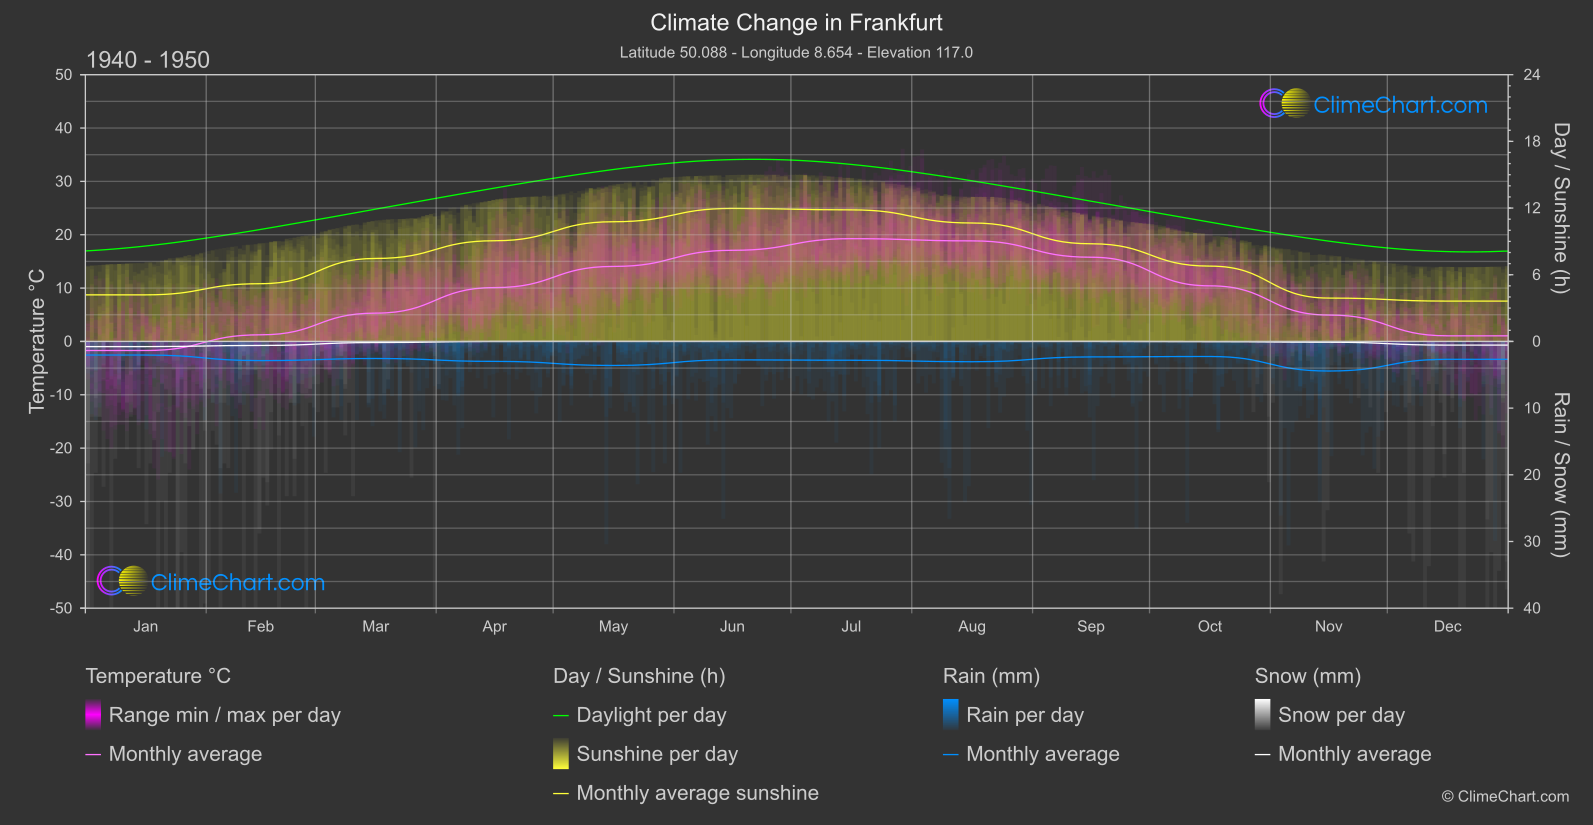
Frankfurt, Germany experiences notable changes in its climate and weather patterns. From the data collected, it is evident that June has seen the highest increase in temperature, while October has experienced the most significant rise in rainfall. Snowfall has decreased over the years, with December showing a notable decline. Additionally, sunshine duration has varied, with October witnessing a substantial decrease in hours of sunlight.
Climate Change Data Overview for Frankfurt, Germany
Explore the comprehensive climate change data for Frankfurt, Germany. This detailed table provides valuable insights into temperature variations, precipitation levels, and seasonal changes influenced by climate change, helping you understand the unique weather patterns of this region.
Temperature °C
| Month | ⌀ 1940 - 1950 | ⌀ 2013 - 2023 | +/- |
|---|---|---|---|
| Jan | -1.70 | 2.69 | 4.40 |
| Feb | 1.24 | 3.37 | 2.13 |
| Mar | 5.30 | 6.00 | 0.69 |
| Apr | 10.09 | 10.11 | 0.02 |
| May | 14.06 | 14.34 | 0.28 |
| Jun | 17.08 | 19.39 | 2.31 |
| Jul | 19.26 | 21.03 | 1.77 |
| Aug | 18.85 | 20.46 | 1.61 |
| Sep | 15.78 | 16.24 | 0.45 |
| Oct | 10.42 | 11.67 | 1.25 |
| Nov | 4.95 | 6.36 | 1.41 |
| Dec | 1.05 | 3.97 | 2.92 |
| ⌀ Month | 9.70 | 11.30 | 1.60 |
Sunshine (h)
| Month | ⌀ 1940 - 1950 | ⌀ 2013 - 2023 | +/- |
|---|---|---|---|
| Jan | 4.19 | 3.17 | -1.02 |
| Feb | 5.19 | 5.42 | 0.23 |
| Mar | 7.47 | 7.40 | -0.06 |
| Apr | 9.06 | 9.78 | 0.72 |
| May | 10.77 | 10.50 | -0.27 |
| Jun | 11.97 | 12.00 | 0.04 |
| Jul | 11.84 | 12.00 | 0.16 |
| Aug | 10.66 | 10.63 | -0.03 |
| Sep | 8.79 | 8.88 | 0.09 |
| Oct | 6.78 | 5.81 | -0.97 |
| Nov | 3.90 | 3.75 | -0.15 |
| Dec | 3.63 | 2.66 | -0.97 |
| ⌀ Month | 7.85 | 7.67 | -0.19 |
Rain (mm)
| Month | ⌀ 1940 - 1950 | ⌀ 2013 - 2023 | +/- |
|---|---|---|---|
| Jan | 1.02 | 1.79 | 0.77 |
| Feb | 1.44 | 1.45 | 0.01 |
| Mar | 1.28 | 1.45 | 0.17 |
| Apr | 1.50 | 1.55 | 0.05 |
| May | 1.80 | 2.32 | 0.52 |
| Jun | 1.38 | 1.98 | 0.59 |
| Jul | 1.41 | 1.81 | 0.40 |
| Aug | 1.52 | 2.02 | 0.50 |
| Sep | 1.16 | 1.73 | 0.56 |
| Oct | 1.13 | 1.90 | 0.78 |
| Nov | 2.22 | 2.10 | -0.12 |
| Dec | 1.34 | 2.08 | 0.74 |
| ⌀ Month | 1.43 | 1.85 | 0.42 |
Snow (mm)
| Month | ⌀ 1940 - 1950 | ⌀ 2013 - 2023 | +/- |
|---|---|---|---|
| Jan | 0.39 | 0.28 | -0.11 |
| Feb | 0.30 | 0.16 | -0.14 |
| Mar | 0.08 | 0.07 | -0.02 |
| Apr | 0.00 | 0.03 | 0.03 |
| May | 0.00 | 0.00 | 0.00 |
| Jun | 0.00 | 0.00 | 0.00 |
| Jul | 0.00 | 0.00 | 0.00 |
| Aug | 0.00 | 0.00 | 0.00 |
| Sep | 0.00 | 0.00 | 0.00 |
| Oct | 0.02 | 0.00 | -0.02 |
| Nov | 0.06 | 0.07 | 0.00 |
| Dec | 0.28 | 0.16 | -0.11 |
| ⌀ Month | 0.09 | 0.06 | -0.03 |