Climate Change Chart of Frankfurt am Main, Germany
Comprehensive Climate Change Chart of Frankfurt am Main, Germany: Monthly Averages and Impact Trends
Exploring the changing climate in Frankfurt am Main, Germany reveals intriguing insights into temperature, rainfall, snowfall, and sunshine duration over the years.
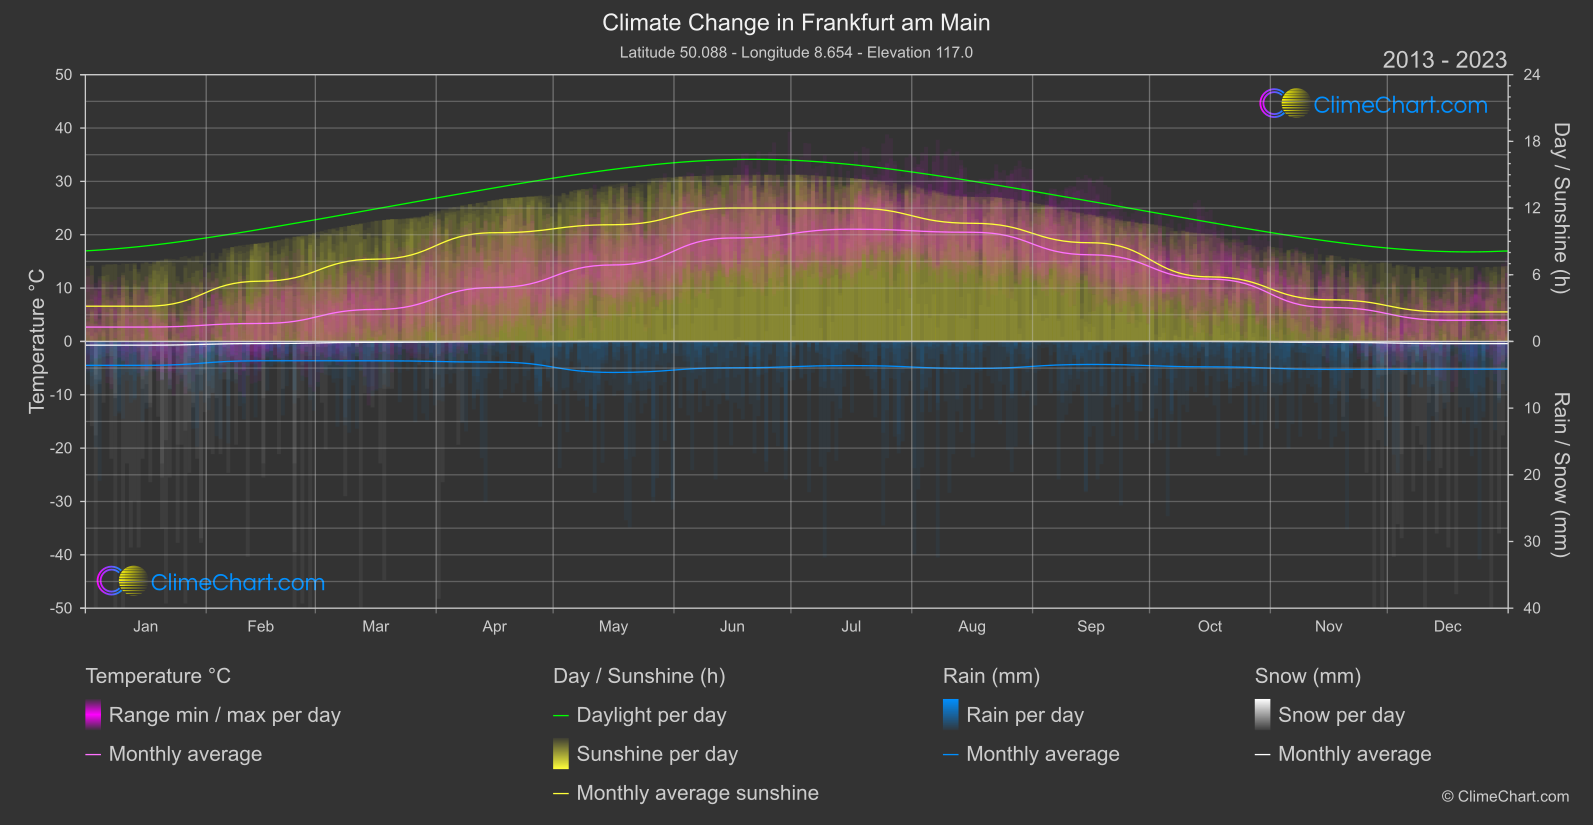
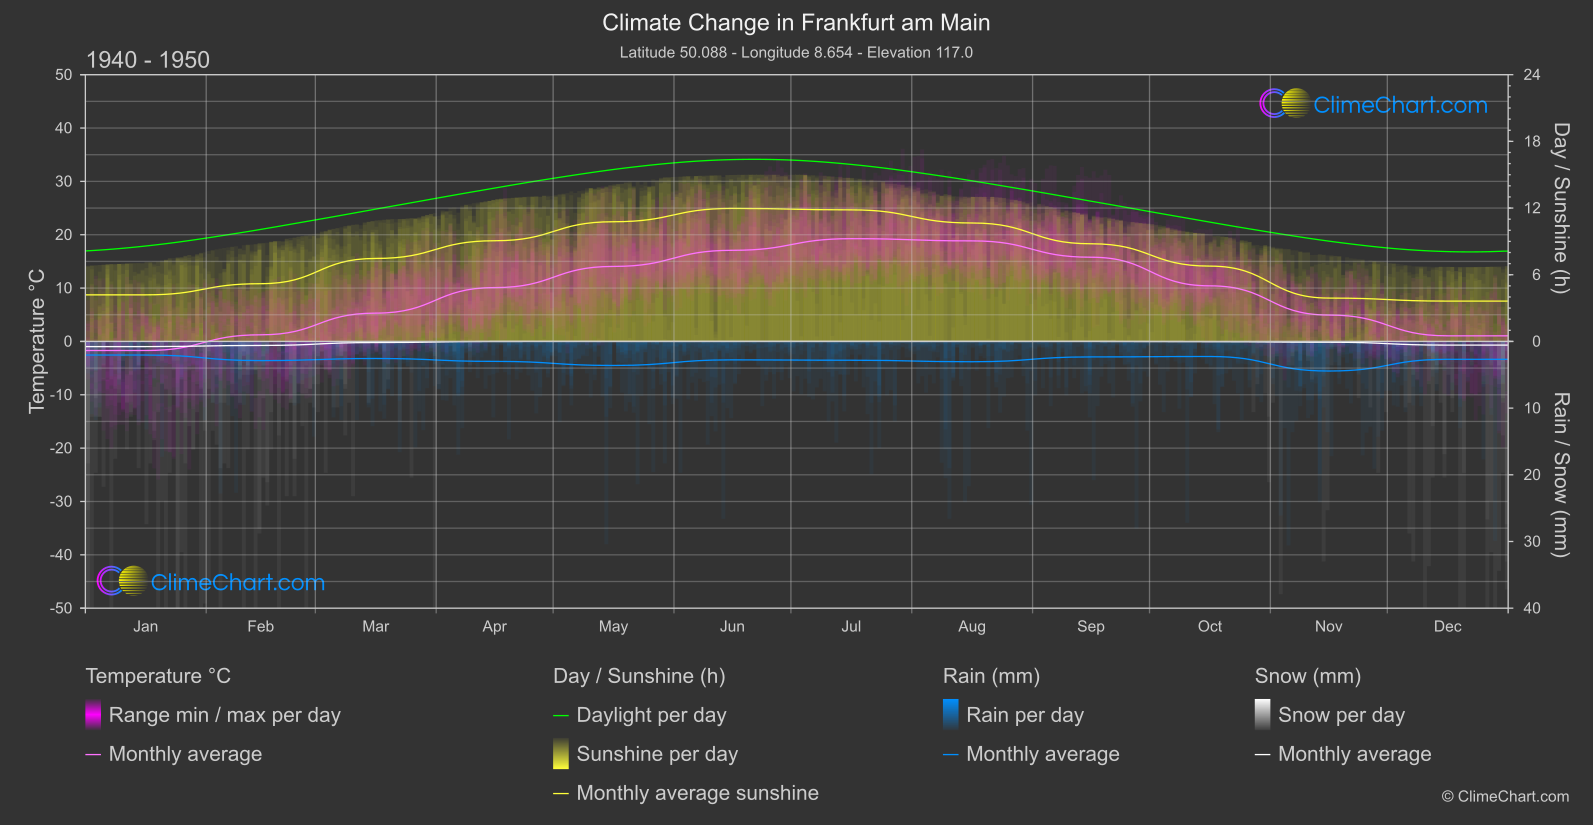
Frankfurt am Main, Germany, has experienced notable changes in temperature, rainfall, snowfall, and sunshine duration over the years. From the data analysis, it is observed that June had the highest increase in temperature, while October saw the most significant rise in rainfall. Snowfall remained relatively stable over the studied periods. Moreover, sunshine duration showed variations throughout the year, with November experiencing the most decline in sunshine hours.
Climate Change Data Overview for Frankfurt am Main, Germany
Explore the comprehensive climate change data for Frankfurt am Main, Germany. This detailed table provides valuable insights into temperature variations, precipitation levels, and seasonal changes influenced by climate change, helping you understand the unique weather patterns of this region.
Temperature °C
| Month | ⌀ 1940 - 1950 | ⌀ 2013 - 2023 | +/- |
|---|---|---|---|
| Jan | -1.70 | 2.69 | 4.40 |
| Feb | 1.24 | 3.37 | 2.13 |
| Mar | 5.30 | 6.00 | 0.69 |
| Apr | 10.09 | 10.11 | 0.02 |
| May | 14.06 | 14.34 | 0.28 |
| Jun | 17.08 | 19.39 | 2.31 |
| Jul | 19.26 | 21.03 | 1.77 |
| Aug | 18.85 | 20.46 | 1.61 |
| Sep | 15.78 | 16.24 | 0.45 |
| Oct | 10.42 | 11.67 | 1.25 |
| Nov | 4.95 | 6.36 | 1.41 |
| Dec | 1.05 | 3.97 | 2.92 |
| ⌀ Month | 9.70 | 11.30 | 1.60 |
Sunshine (h)
| Month | ⌀ 1940 - 1950 | ⌀ 2013 - 2023 | +/- |
|---|---|---|---|
| Jan | 4.19 | 3.17 | -1.02 |
| Feb | 5.19 | 5.42 | 0.23 |
| Mar | 7.47 | 7.40 | -0.06 |
| Apr | 9.06 | 9.78 | 0.72 |
| May | 10.77 | 10.50 | -0.27 |
| Jun | 11.97 | 12.00 | 0.04 |
| Jul | 11.84 | 12.00 | 0.16 |
| Aug | 10.66 | 10.63 | -0.03 |
| Sep | 8.79 | 8.88 | 0.09 |
| Oct | 6.78 | 5.81 | -0.97 |
| Nov | 3.90 | 3.75 | -0.15 |
| Dec | 3.63 | 2.66 | -0.97 |
| ⌀ Month | 7.85 | 7.67 | -0.19 |
Rain (mm)
| Month | ⌀ 1940 - 1950 | ⌀ 2013 - 2023 | +/- |
|---|---|---|---|
| Jan | 1.02 | 1.79 | 0.77 |
| Feb | 1.44 | 1.45 | 0.01 |
| Mar | 1.28 | 1.45 | 0.17 |
| Apr | 1.50 | 1.55 | 0.05 |
| May | 1.80 | 2.32 | 0.52 |
| Jun | 1.38 | 1.98 | 0.59 |
| Jul | 1.41 | 1.81 | 0.40 |
| Aug | 1.52 | 2.02 | 0.50 |
| Sep | 1.16 | 1.73 | 0.56 |
| Oct | 1.13 | 1.90 | 0.78 |
| Nov | 2.22 | 2.10 | -0.12 |
| Dec | 1.34 | 2.08 | 0.74 |
| ⌀ Month | 1.43 | 1.85 | 0.42 |
Snow (mm)
| Month | ⌀ 1940 - 1950 | ⌀ 2013 - 2023 | +/- |
|---|---|---|---|
| Jan | 0.39 | 0.28 | -0.11 |
| Feb | 0.30 | 0.16 | -0.14 |
| Mar | 0.08 | 0.07 | -0.02 |
| Apr | 0.00 | 0.03 | 0.03 |
| May | 0.00 | 0.00 | 0.00 |
| Jun | 0.00 | 0.00 | 0.00 |
| Jul | 0.00 | 0.00 | 0.00 |
| Aug | 0.00 | 0.00 | 0.00 |
| Sep | 0.00 | 0.00 | 0.00 |
| Oct | 0.02 | 0.00 | -0.02 |
| Nov | 0.06 | 0.07 | 0.00 |
| Dec | 0.28 | 0.16 | -0.11 |
| ⌀ Month | 0.09 | 0.06 | -0.03 |